Technical Indicators
openbb-charting includes a price chart that draws candlesticks and volume for one symbol's OHLC(V) history and layers technical indicators on top of it, either on the price panel or in panels below. The indicators are computed at draw time with pandas-ta-openbb; they are a visual aid, separate from the openbb-technical commands that return indicator values as data.
The price chart is the price_historical function in openbb_charting.charts.price_historical. A command uses it when its chart view calls that function.
Adding a price chart to a V5 command
The provider namespaces documented for V5 do not register price chart views. A small package can add one for any command that returns OHLC(V) history. Each method on the view class is named after the command's route, with slashes replaced by underscores. Save the class as my_price_charts/views.py:
from openbb_charting.charts.price_historical import price_historical


class PriceViews:
    @staticmethod
    def cboe_equity_historical(**kwargs):
        return price_historical(**kwargs)

    @staticmethod
    def nasdaq_equity_historical(**kwargs):
        return price_historical(**kwargs)
Register the class in the package's pyproject.toml, install the package from its directory, and rebuild:
[project]
name = "my-price-charts"
version = "0.1.0"
dependencies = ["openbb-charting"]

[project.entry-points."openbb_charting_extension"]
my_price_charts = "my_price_charts.views:PriceViews"

[build-system]
requires = ["hatchling"]
build-backend = "hatchling.build"
pip install -e .
openbb-build
obb.cboe.equity.historical and obb.nasdaq.equity.historical now accept chart=True, and their results can be redrawn with indicators. The charting extension guide covers views in more detail.
Drawing indicators
Pass an indicators dictionary to charting.to_chart(). Each key names an indicator and each value is a dictionary of its arguments; an empty dictionary uses the defaults.
from openbb import obb

spy = obb.cboe.equity.historical(symbol="SPY", start_date="2024-01-01", chart=True)
spy.show()

spy.charting.to_chart(
    indicators={
        "ema": {"length": [20, 50]},
        "bbands": {"length": 20},
        "rsi": {"length": 14},
        "macd": {},
    },
    title="SPY",
)
Sample price chart
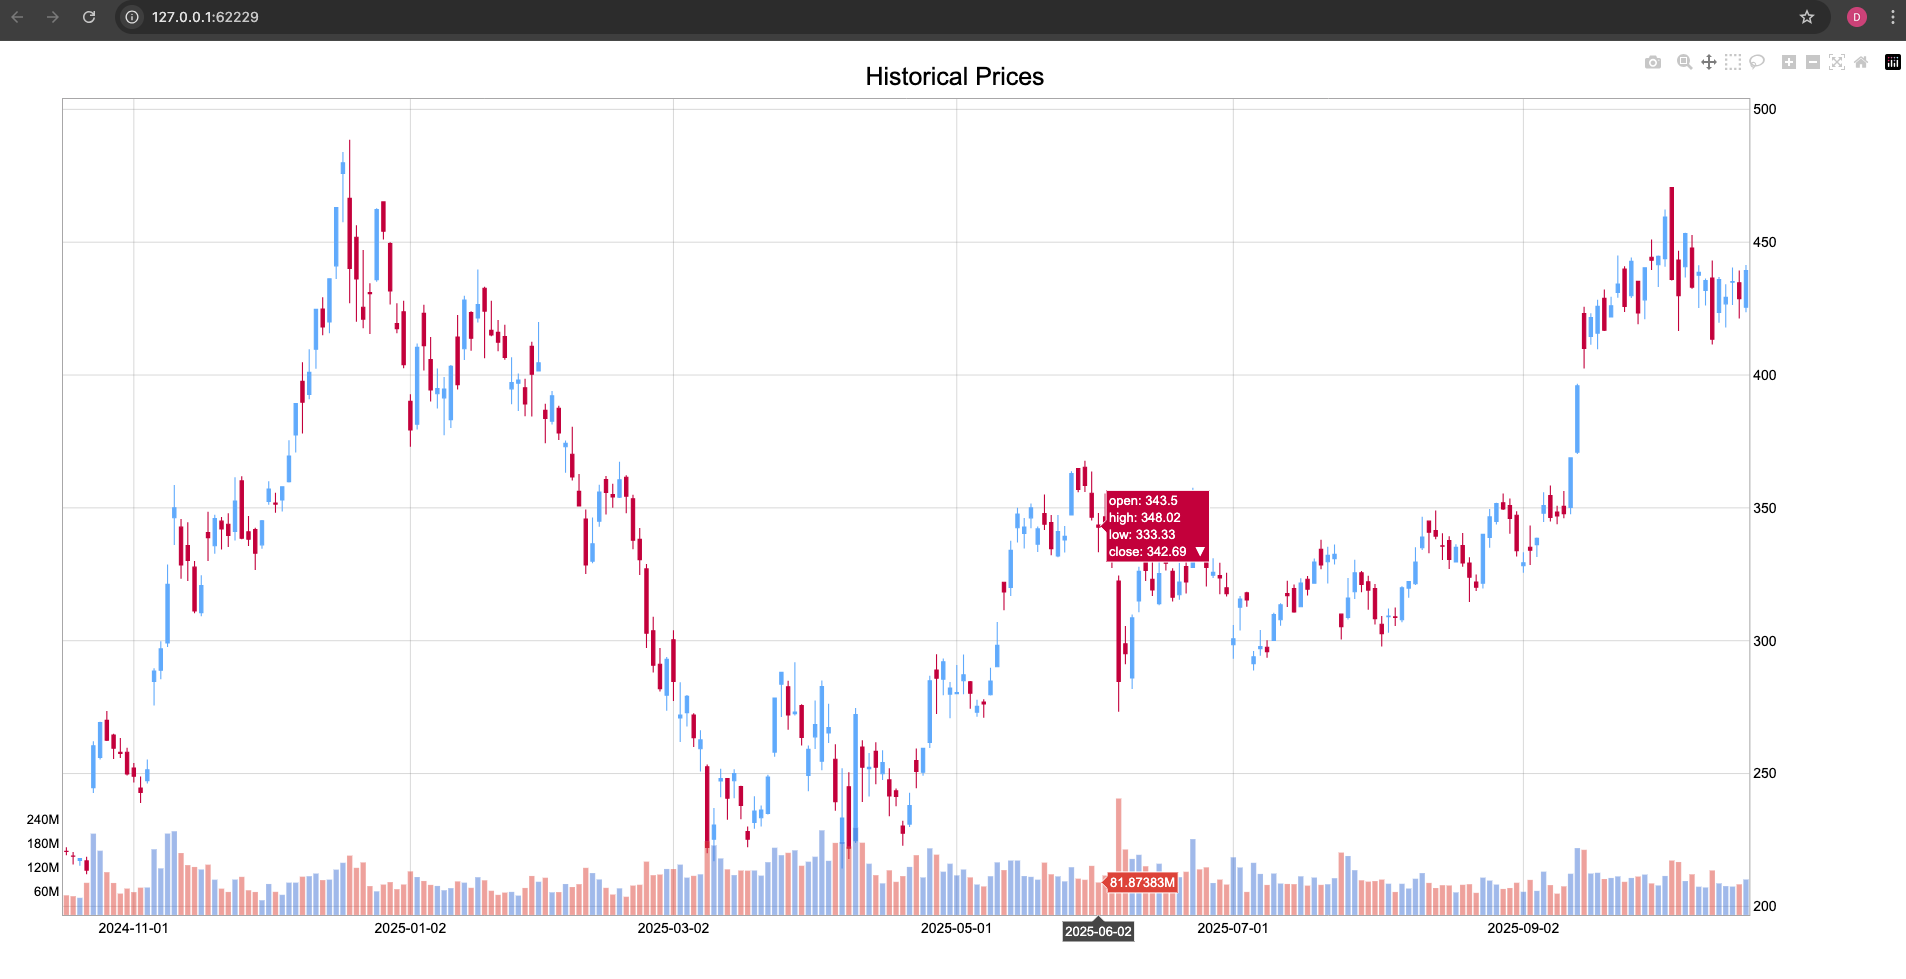
Other keyword arguments control the price panel. candles=False draws a line of the close instead of candlesticks, heikin_ashi=True converts the candles to Heikin Ashi, volume=False hides the volume bars, and title sets the chart title. render=False stores the figure on the result without displaying it.
spy.charting.to_chart(
    indicators={"kc": {}, "adx": {"length": 14}, "obv": {}},
    heikin_ashi=True,
)
Sample charts with indicators
Indicators apply only when the data holds a single symbol. With several symbols, the price chart draws one line per symbol, as cumulative returns when there are more than two, and ignores indicators.
Available indicators
For most keys, the arguments are passed unchanged to the pandas-ta-openbb function of the same name, so any argument that function accepts can be set; omitted arguments take that function's defaults. The moving averages read only length, which can be an integer or a list of integers to draw several lines.
| Key | Drawn | Needs | Arguments |
|---|---|---|---|
sma, ema, wma, hma, zlma, rma | On price | close | length |
bbands | On price | close | pandas-ta bbands |
kc | On price | high, low, close | pandas-ta kc |
donchian | On price | high, low | pandas-ta donchian |
ichimoku | On price | high, low, close | conversion_period 9, base_period 26, lagging_line_period 52, displacement 26 |
fib | On price | close | limit 120, start_date, end_date |
clenow | On price | close | window 90 |
demark | On price | close | min_val 5 |
rsi | Subplot | close | pandas-ta rsi |
macd | Subplot | close | pandas-ta macd |
stoch | Subplot | high, low, close | pandas-ta stoch |
cci | Subplot | high, low, close | pandas-ta cci |
fisher | Subplot | high, low | pandas-ta fisher |
cg | Subplot | close | pandas-ta cg |
adx | Subplot | high, low, close | pandas-ta adx |
aroon | Subplot, two rows | high, low | pandas-ta aroon |
atr | Subplot | high, low, close | pandas-ta atr |
ad | Subplot | high, low, close, volume | pandas-ta ad |
adosc | Subplot | high, low, close, volume | pandas-ta adosc |
obv | Subplot | close, volume | pandas-ta obv |
fib and clenow are calculated with helpers from openbb-technical, which must be installed. Volume-based indicators are skipped with a warning when the data has no volume.
The chart holds at most four subplot rows below the price panel, and indicators beyond that are skipped with a warning. Use only the keys in this table: an unrecognized key makes the indicator calculation fail with a warning, which can leave the other calculated indicators off the chart.
Charting.indicators() returns a model describing the indicator set, printed as a parameter listing. Its field names are not always the keys the chart reads: the accumulation/distribution oscillator is listed as adoscillator but drawn only under the key adosc, and the fib, clenow, demark, and ichimoku parameter names it shows differ from the ones in the table above.