Vega-Lite Chart
A widget that demonstrates how to use Vega-Lite to render a chart. Vega-Lite is a high-level grammar of interactive graphics — you describe the chart declaratively as JSON, and the renderer handles the rest.
For Vega-Lite, your endpoint simply needs to return a Vega-Lite JSON specification. No extra Python package is required to build the spec — but if you'd like helpers, you can install altair:
pip install altair
from fastapi import FastAPI, Query
app = FastAPI()
def _vega_theme(theme: str) -> dict:
"""Return mark color + base config for the given theme."""
if theme == "light":
colors = {"fg": "#1a1a1a", "grid": "#e5e5e5", "mark": "#2563eb"}
else:
colors = {"fg": "#e5e7eb", "grid": "#2a2a2a", "mark": "#60a5fa"}
return {
"mark_color": colors["mark"],
"config": {
"background": "transparent",
"axis": {
"labelColor": colors["fg"],
"titleColor": colors["fg"],
"gridColor": colors["grid"],
"domainColor": colors["grid"],
"tickColor": colors["grid"],
},
"legend": {"labelColor": colors["fg"], "titleColor": colors["fg"]},
"title": {"color": colors["fg"]},
"view": {"stroke": "transparent"},
},
}
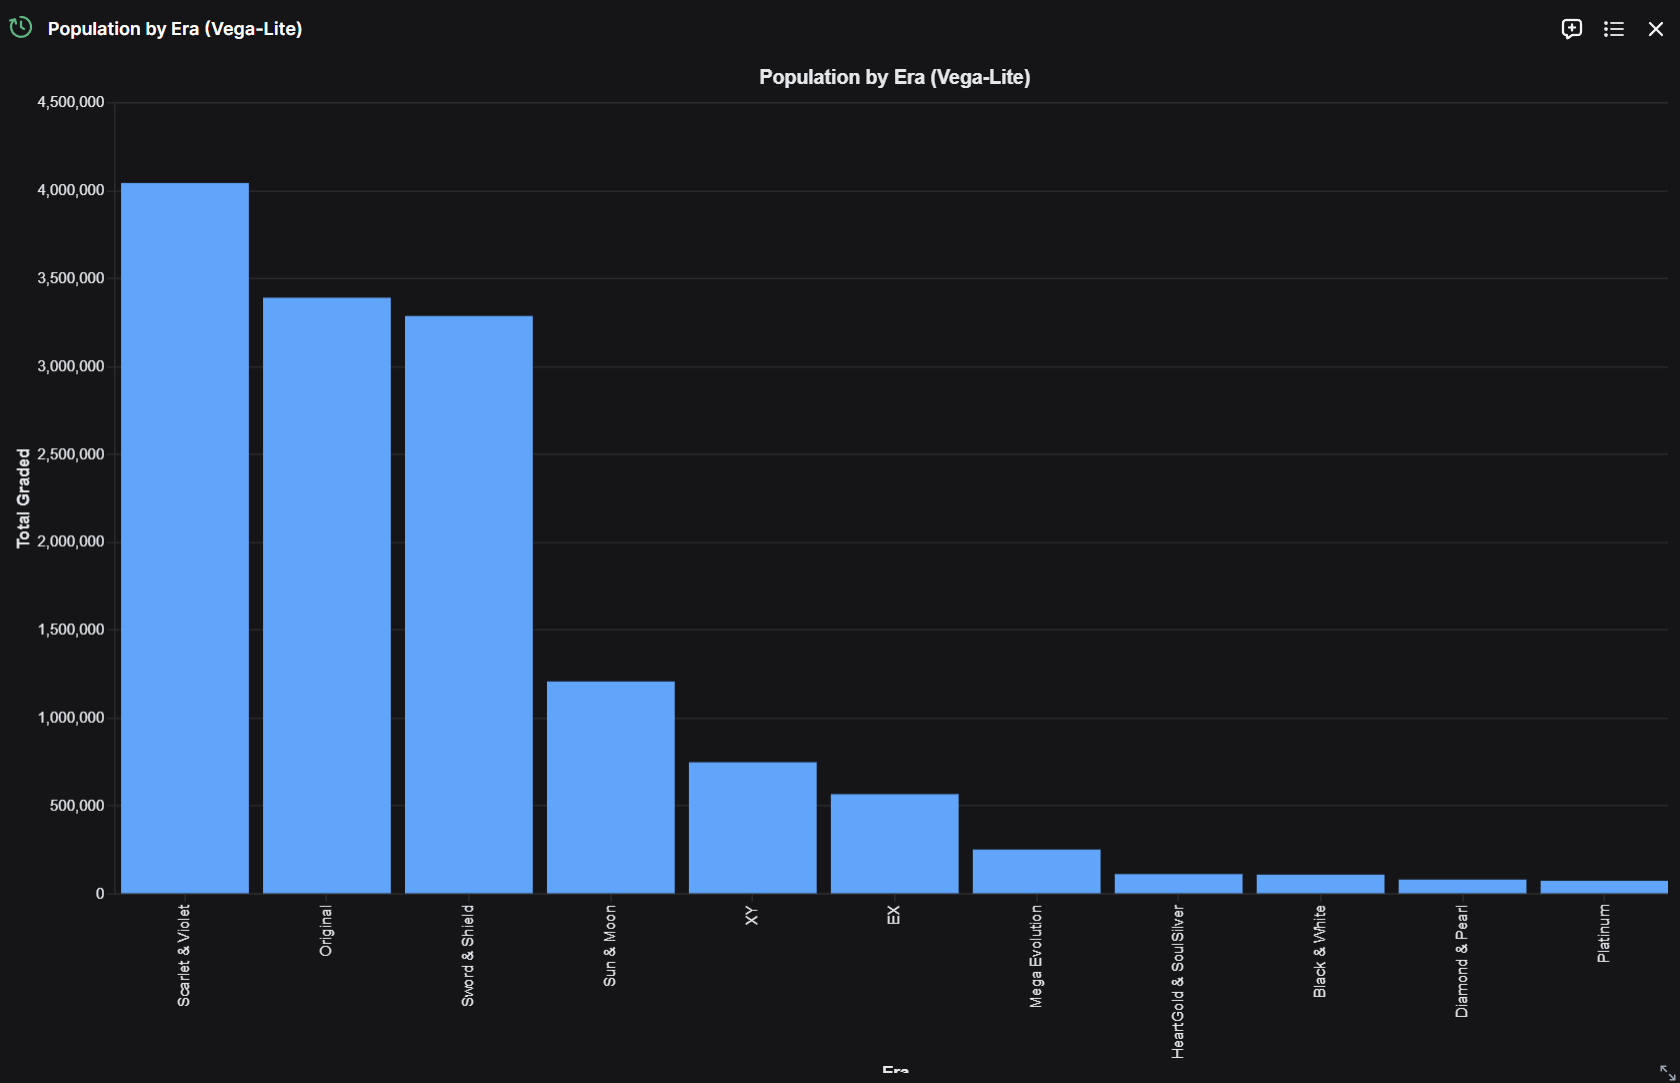
@register_widget({
"name": "Population by Era (Vega-Lite)",
"description": "Vega-Lite bar chart of population by era",
"type": "chart-vegalite",
"endpoint": "era_population_vega",
"gridData": {"w": 20, "h": 12}
})
@app.get("/era_population_vega")
def get_era_population_vega(theme: str = Query("dark")):
"""Vega-Lite bar chart of total population by era."""
values = [
{"era": "Pre-WWII", "total": 8_500_000},
{"era": "WWII", "total": 12_300_000},
{"era": "Post-WWII", "total": 18_700_000},
{"era": "Modern", "total": 24_500_000},
{"era": "Contemporary", "total": 31_200_000},
]
t = _vega_theme(theme)
return {
"$schema": "https://vega.github.io/schema/vega-lite/v5.json",
"title": "Population by Era (Vega-Lite)",
"width": "container",
"height": "container",
"autosize": {"type": "fit", "contains": "padding"},
"config": t["config"],
"data": {"values": values},
"mark": {"type": "bar", "color": t["mark_color"], "tooltip": True},
"encoding": {
"x": {"field": "era", "type": "nominal", "sort": "-y", "title": "Era"},
"y": {"field": "total", "type": "quantitative", "title": "Total"},
},
}
Note that for Vega-Lite, the type field is set to "chart-vegalite" instead of "chart" (Plotly) or "chart-highcharts" (Highcharts).
The endpoint must return a valid Vega-Lite JSON spec. The two most important pieces are:
data.values— an inline array of records to plot. You can also usedata.urlto point at a remote dataset.encoding— maps fields in your data to visual channels (x,y,color,size, etc.).
Theme Support
The example includes full theme support for both dark and light modes. The theme parameter is automatically provided by OpenBB Workspace based on the user's current display mode (dark/light). The _vega_theme helper returns a config block that styles axes, legends, titles, and the view background to match the workspace.
- Dark mode: light text (
#e5e7eb), dark grid lines (#2a2a2a), light blue mark (#60a5fa) - Light mode: dark text (
#1a1a1a), light grid lines (#e5e5e5), darker blue mark (#2563eb)
The background is set to "transparent" so the chart blends into the widget canvas regardless of theme.
Additional Resources
For more information on Vega-Lite specifications, visit the Vega-Lite Documentation and the example gallery.
You can find more examples of how to set up your own backend in the Backend for OpenBB Workspace GitHub.