Plotly Chart
This guide will walk you through the process of creating a chart widget for OpenBB Terminal Pro. We will be using Plotly to create the chart in our example. By the end of this guide, you will have a working chart widget that you can add to OpenBB Terminal Pro.
Step 1: Set Up Your Project
To get started, create the main application file and the widget configuration file. You will only need these two files:
main.py: This file will contain your FastAPI application code.widgets.json: This file will define the configuration for your widget.
The backend will use the same FastAPI setup and structure as described in the Custom Backend page.
Step 2: Create the Chart Endpoint
Edit the main.py file and add the following code. This code sets up a FastAPI application with an endpoint to serve the widget configuration and data for a chart:
...
# Chart endpoint
@app.get("/chains")
def get_chains():
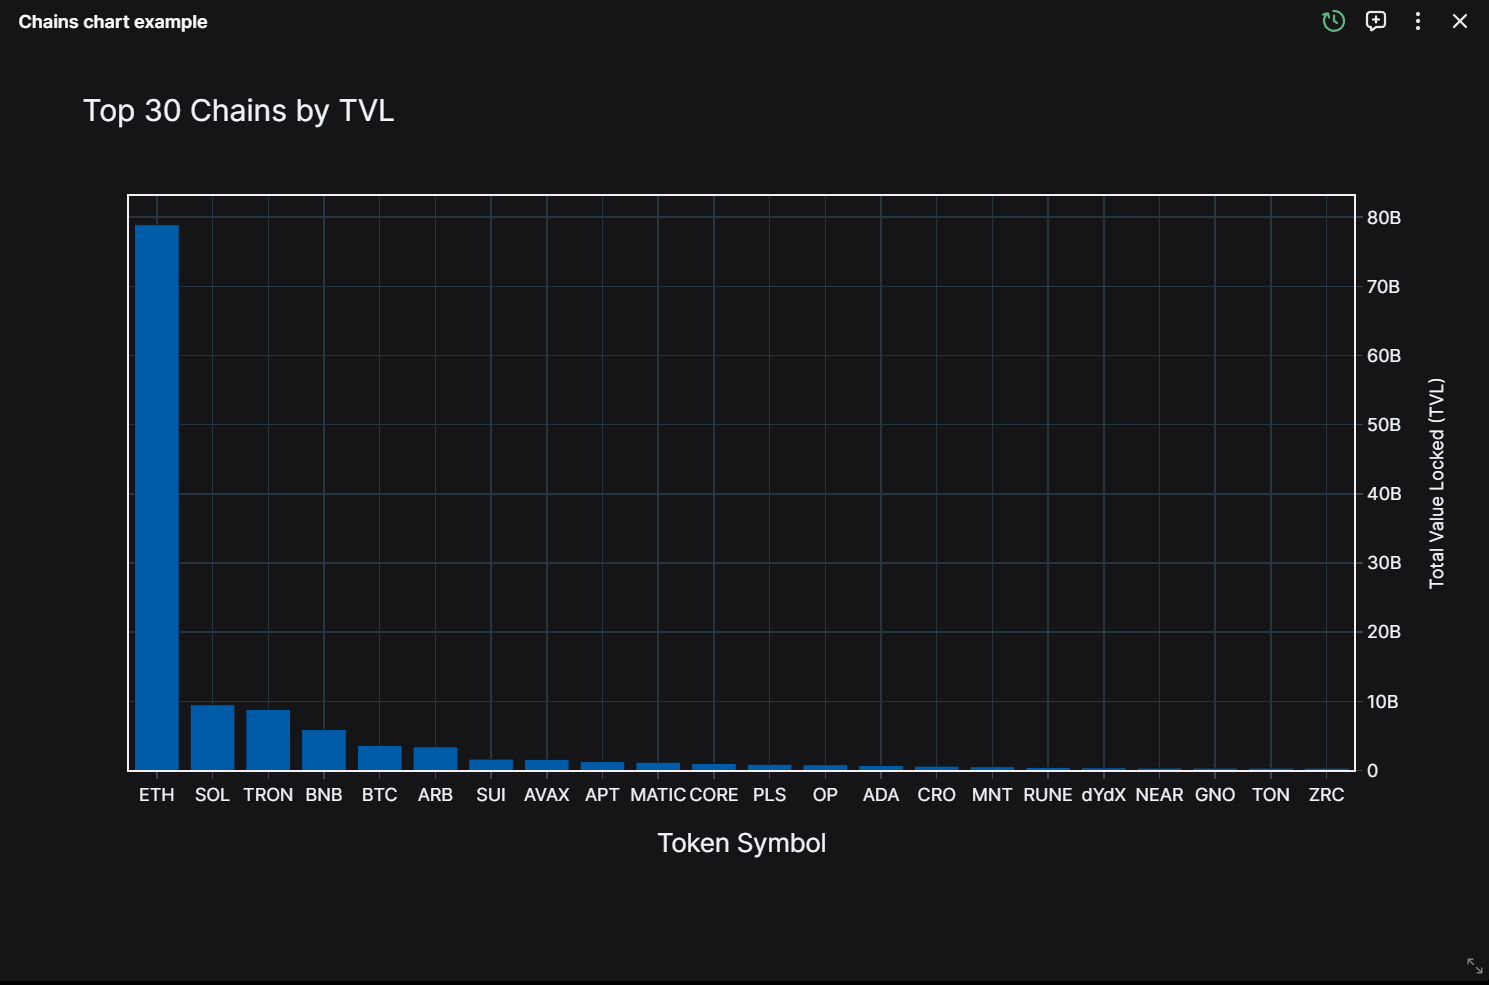
"""Fetch and display the current TVL of all chains using Defi Llama."""
params = {}
response = requests.get("https://api.llama.fi/v2/chains", params=params)
if response.status_code == 200:
# Create a DataFrame from the JSON data
df = pd.DataFrame(response.json())
# Sort the DataFrame by 'tvl' in descending order and select the top 30
top_30_df = df.sort_values(by='tvl', ascending=False).head(30)
# Create a bar chart using Plotly
figure = go.Figure(
data=[go.Bar(x=top_30_df["tokenSymbol"], y=top_30_df["tvl"])],
layout=go.Layout(
title="Top 30 Chains by TVL",
xaxis_title="Token Symbol",
yaxis_title="Total Value Locked (TVL)"
)
)
# Convert the Plotly figure to JSON format for frontend rendering
# This is a crucial step that allows the figure to be displayed in OpenBB Terminal Pro
return json.loads(figure.to_json())
print(f"Request error {response.status_code}: {response.text}")
return JSONResponse(
content={"error": response.text}, status_code=response.status_code
)
Because we are using Plotly, we need to convert the figure to JSON format for frontend rendering. Returning the figure directly will not work - so utilizing the figure.to_json() method is crucial.
Edit the widgets.json File
Edit the widgets.json file and add the following JSON data. This configuration defines the widget's properties and how it should be displayed:
{
  "chains_plotly": {
    "name": "Chains chart example",
    "description": "Get current TVL of all chains and plot it!",
    "category": "crypto",
    "type": "chart",
    "endpoint": "chains",
    "gridData": {
      "w": 20,
      "h": 9
    }
  }
}
For more information on the widgets.json file, see the Widgets.json page.
Step 3: Run the Application
Start the FastAPI Server using Uvicorn. This will host your backend locally:
uvicorn main:app --host localhost --port 5050
Step 4: Add to OpenBB Pro
Navigate to OpenBB Pro Data Connectors and add your backend by clicking on the + Add Data button in the top right corner. Select Custom Backend and fill in the details. Your URL will be http://localhost:5050.
Once you have added your backend, you can find the widget in the Crypto category with the name Chains chart example.
Theme
You can also switch the layout to light or dark mode by adding the "theme" parameter to the function. We send the current theme automatically to the backend and you can use it to switch the layout.
# Chart endpoint
@app.get("/chains")
def get_chains(theme: str = "dark"):

    ...
    figure.update_layout(template="plotly_dark" if theme == "dark" else "plotly_white")
    return json.loads(figure.to_json())
Additional Resources
You can find more examples of how to set up your own backend in the Backend for Terminal Pro GitHub.