openbb-charting
This extension provides a charting library for Open Data Platform by OpenBB.
The library includes:
- API charting infrastructure
- Mutable
chartattribute in every response object - Plotly charting components
- Pre-built charts for a set of endpoints
- Optional extra for dedicated window creation
- Includes an interactive
table()method in the Python Interface
- Includes an interactive
The charting library is an OBBject extension, which means you'll have the functionality it exposes on every command result.
Installation
To install the extension, run the following command in this folder:
pip install openbb-charting
Extras
The PyWry dependency handles the display of interactive charts and tables in a separate window.
Add the PyWry extra for standalone window creation.
pip install "openbb-charting[pywry]"
PyWry on Linux
For Linux systems, the PyWry dependency requires certain dependencies to be installed first.
-
Debian-based / Ubuntu / Mint:
sudo apt install libwebkit2gtk-4.0-dev -
Arch Linux / Manjaro:
sudo pacman -S webkit2gtk -
Fedora:
sudo dnf install gtk3-devel webkit2gtk3-devel
Set Theme
The default theme setting is dark, and this can be changed to "light" in the user preference
for both, chart_style and table_style.
For the current Python session, set them with:
from openbb import obb

obb.user.prefernces.chart_style="dark"
obb.user.prefernces.table_style="light"
Available Charts
Not all the endpoints are supported by the charting extension. To discover which endpoints are supported, you can run the following command:
from openbb_charting import Charting
Charting.functions()
This produces the same result as using the class method from the OBBject.charting function response.
Methods
-------
show
    Display chart and save it to the OBBject.
to_chart
    Redraw the chart and save it to the OBBject, with an optional entry point for Data.
functions
    Return a list of Platform commands with charting functions.
get_params
    Return the charting parameters for the function the OBBject was created from.
indicators
    Return the list of the available technical indicators to use with the `to_chart` method and OHLC+V data.
table
    Display an interactive table.
create_line_chart
    Create a line chart from external data.
create_bar_chart
    Create a bar chart, on a single x-axis with one or more values for the y-axis, from external data.
create_correlation_matrix
    Create a correlation matrix from external data.
toggle_chart_style
    Toggle the chart style, of an existing chart, between light and dark mode.
Usage
This extension requires that the user preference for output_type is set to, "OBBject", the default state.
To use, run any of the ODP Python Package endpoints with the chart argument set to True.
>>> from openbb import obb
>>> equity_data = obb.equity.price.historical(symbol="TSLA", chart=True)
>>> equity_data

OBBject[T]

id: 068ec8c8-9ea2-78dc-8000-97703428789b
results: [{'date': datetime.date(2024, 10, 14), 'open': 220.1300048828125, 'high': ...
provider: yfinance
warnings: None
chart: {'content': {'data': [{'close': {'dtype': 'f8', 'bdata': 'AAAAwB5la0AAAACAPX...
extra: {'metadata': {'arguments': {'provider_choices': {'provider': 'yfinance'}, 's...
The chart will be returned in the response object under the chart attribute.
Display the current figure by calling:
equity_data.show()
Sample Chart
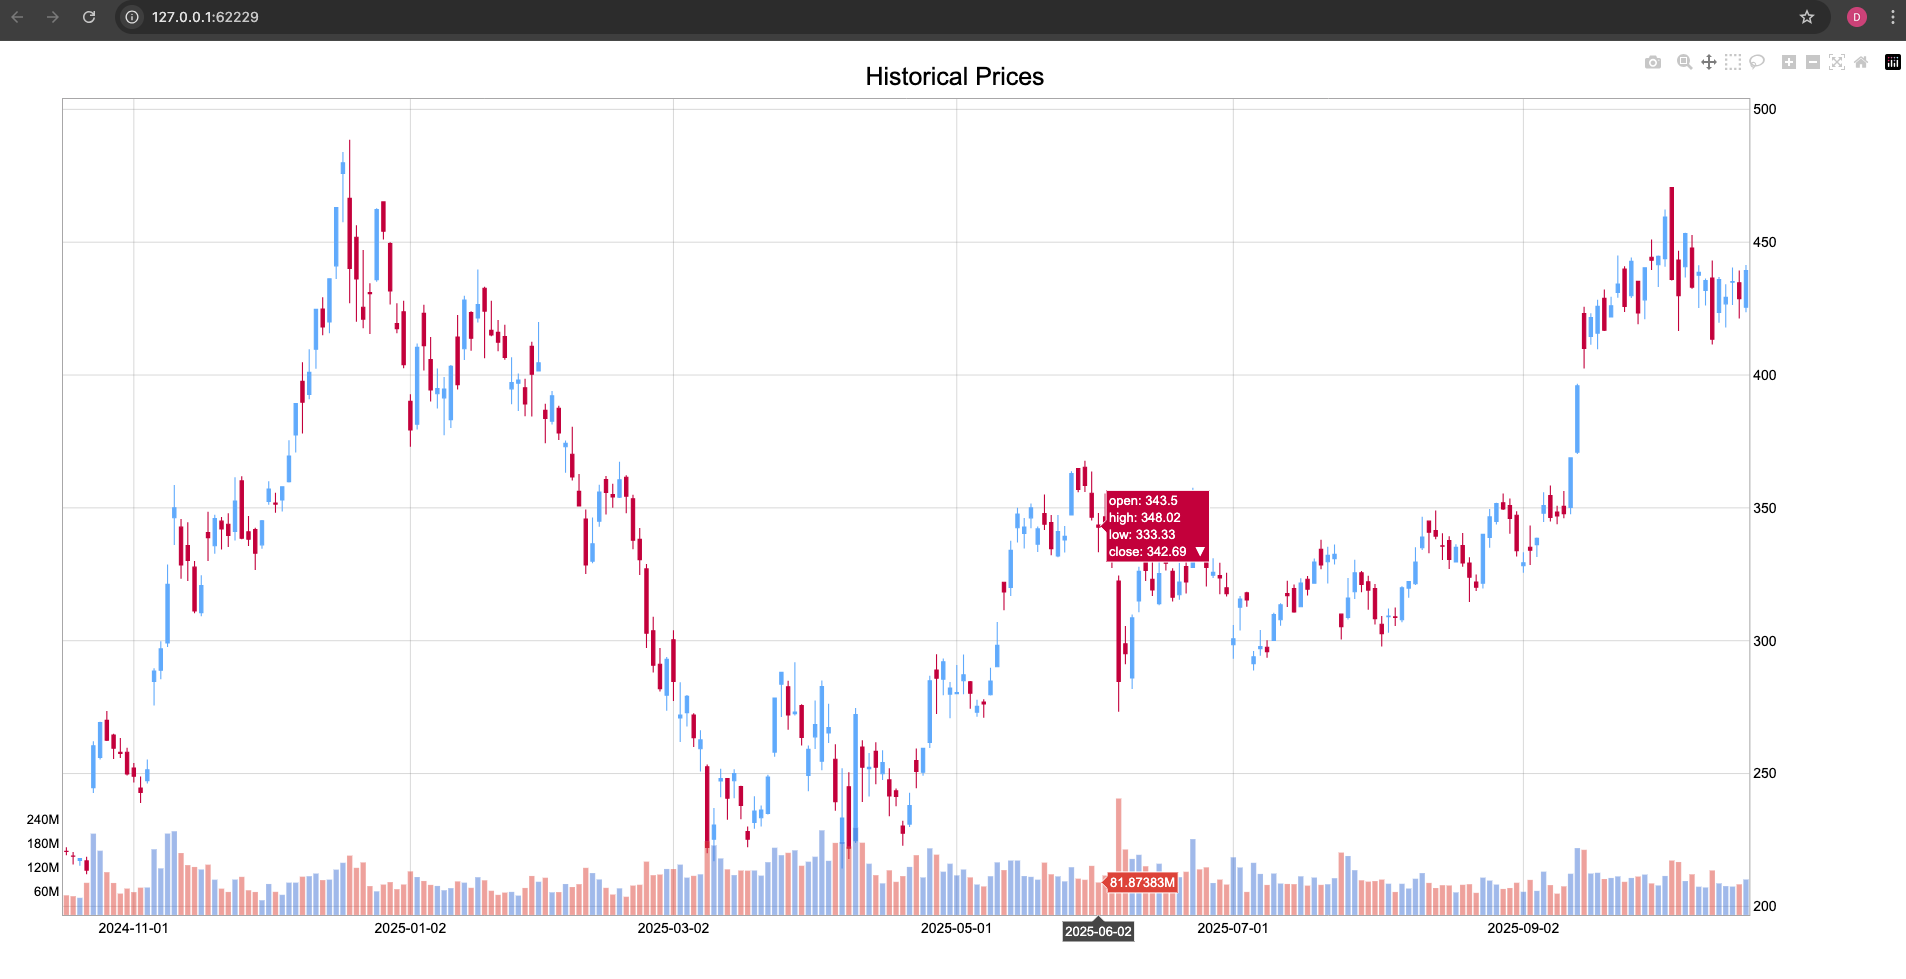
Chart Params
When a supported endpoint is called with chart=True, chart parameters can be passed as a nested dictionary under the name, chart_params.
chart_params = dict(
    title="AAPL 50/200 Day EMA",
    indicators=dict(
        ema=dict(length=[50,200]),
    ),
)
params = dict(
    symbol="AAPL",
    start_date="2022-01-01",
    provider="yfinance",
    chart=True,
    chart_params=chart_params,
)
data = obb.equity.price.historical(**params)
chart_params are sent in the body of the request when using the API.
Passing only chart=True will return a default view which can be modified and drawn again post-request, via the OBBject.
OBBject

id: 06614d74-7443-7201-8000-a65f358136a3
results: [{'date': datetime.date(2022, 1, 3), 'open': 177.8300018310547, 'high': 18...
provider: yfinance
warnings: None
chart: {'content': {'data': [{'close': [182.00999450683594, 179.6999969482422, 174....
extra: {'metadata': {'arguments': {'provider_choices': {'provider': 'yfinance'}, 's...
data.show()
Sample Chart With EMA
Endpoints Without Charts
Most functions do not have dedicated charts. However, it's still possible to generate one automatically. Try passing it through a quantitative analysis command.
data = obb.equity.price.historical(
    symbol="XLK",
    start_date="2023-01-01",
    provider="yfinance",
)
qa = obb.quantitative.rolling.stdev(data.results, target="close")

qa.charting.show(title="XLK Rolling 21 Day Standard Deviation")
Sample Generic Line Chart
Tables
Interactive tables are displayed by the table method.
This functionality is intended for response object exploration and is not suitable for production environments.
data = obb.equity.price.quote("AAPL,MSFT,GOOGL,META,TSLA,AMZN", provider="yfinance")
data.charting.table()
Sample Interactive Table
External data can also be supplied, providing an opportunity to filter or apply Pandas operations before display.
new_df = df.to_df().T
new_df.index.name="metric"
new_df.columns = new_df.loc["symbol"]
new_df.drop("symbol", inplace=True)
data.charting.table(data=new_df)