Overview
Widgets are the fundamental building blocks of OpenBB Workspace, transforming raw financial data into interactive, visual components that drive your analysis. Each widget is a self-contained unit that combines data, visualization, and interactivity into a powerful analytical tool.
What is a Widget?
A widget is more than just a chart or table – it's a data container designed to answer a specific analytical question.

Anatomy of a Widget
Every widget in OpenBB Workspace consists of four essential components that work together:
1. Data Source
The foundation of every widget – where the information comes from. This could be: data feeds, databases, custom data from your organization, static files you've uploaded and more.
2. Metadata Layer
The information that makes widgets discoverable and usable:
- Title: Clear identification of what the widget shows
- Description: Context about the data and its purpose
- Category: Logical grouping (e.g., Equity, Fixed Income, Macro)
- Sub-category: Further classification for better navigation
- Source: Attribution and data provenance
3. Visual Presentation
How the data comes to life on your dashboard:
- Tables: For detailed, sortable and filterable data exploration
- Charts: For visual analysis and trend/pattern recognition
- PDFs: For reports and static documents
- Custom Views: Tailored to specific data types
4. Parameters
Interactive elements that customize what data your widget displays. Input parameters allow you to focus your analysis by setting date ranges, selecting specific tickers, or applying filters that narrow down the dataset to exactly what you need.
Parameters that are linked via the grouping mechanism create synchronization across multiple widgets on your dashboard. When you change a ticker symbol or date range in one widget, all widgets in the group sharing that parameter will update automatically. This creates a cohesive experience where your dashboard responds automatically to your actions.
5. Widget Controls
Widget controls are specific to each widget type. They provide specialized functionality that matches the data and visualization format. These widget-specific controls give you powerful ways to interact with and manipulate your data directly within each widget.
Universal controls
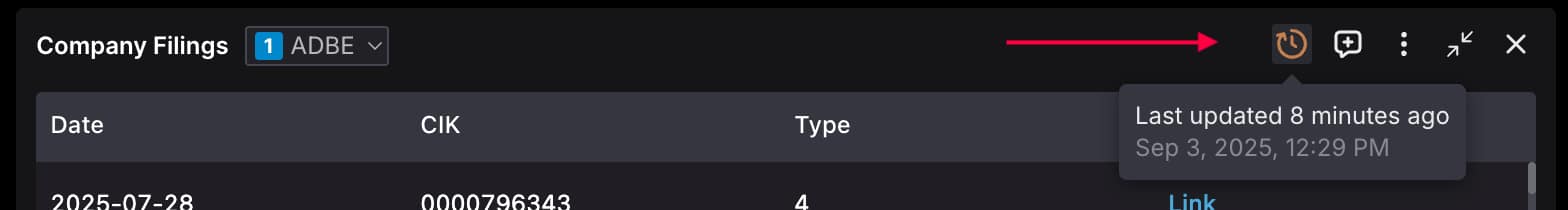
Universal controls available across most widget types include refresh settings for managing data update frequency, export options for saving data in formats like CSV, JSON, and Excel, and view toggles that let you switch between visual representations and raw data tables.
Table widgets
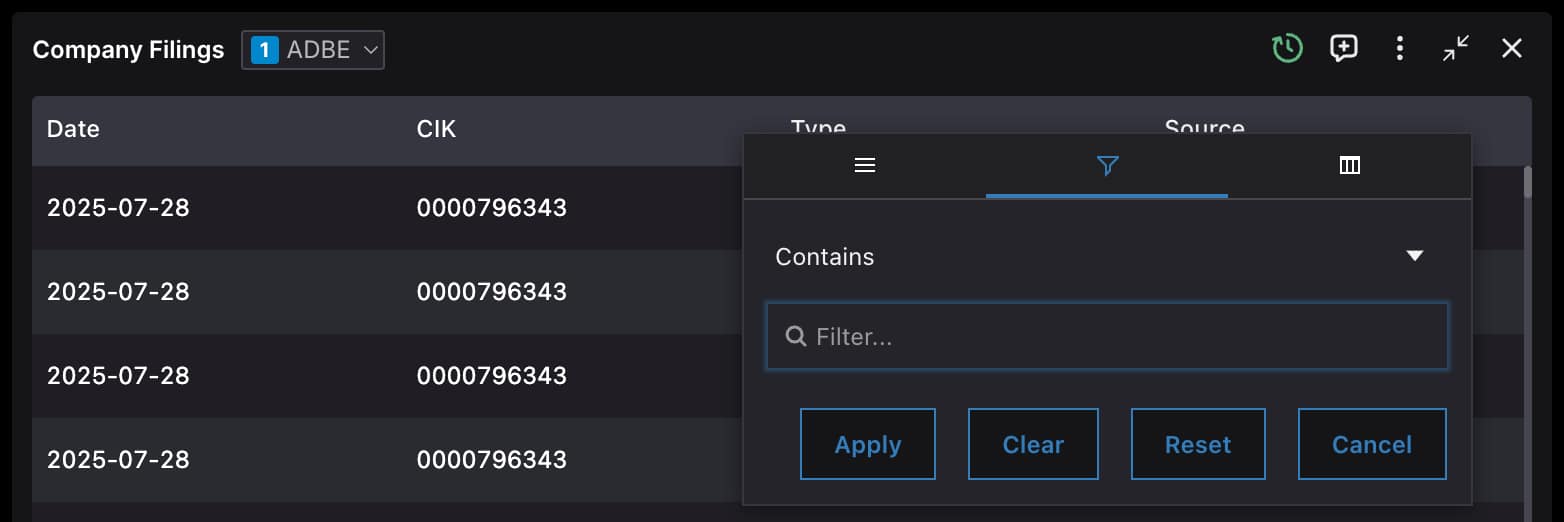
Table widgets powered offer advanced data manipulation capabilities including column sorting, filtering, and grouping functions that let you slice and dice your data without leaving the widget. You can create custom filters, sort by multiple columns, and group data by categories to uncover patterns and insights within large datasets. Table widgets also generate Excel Add-in formulas automatically, allowing you to pull the same data directly into spreadsheets for hybrid analysis workflows.
Chart widgets
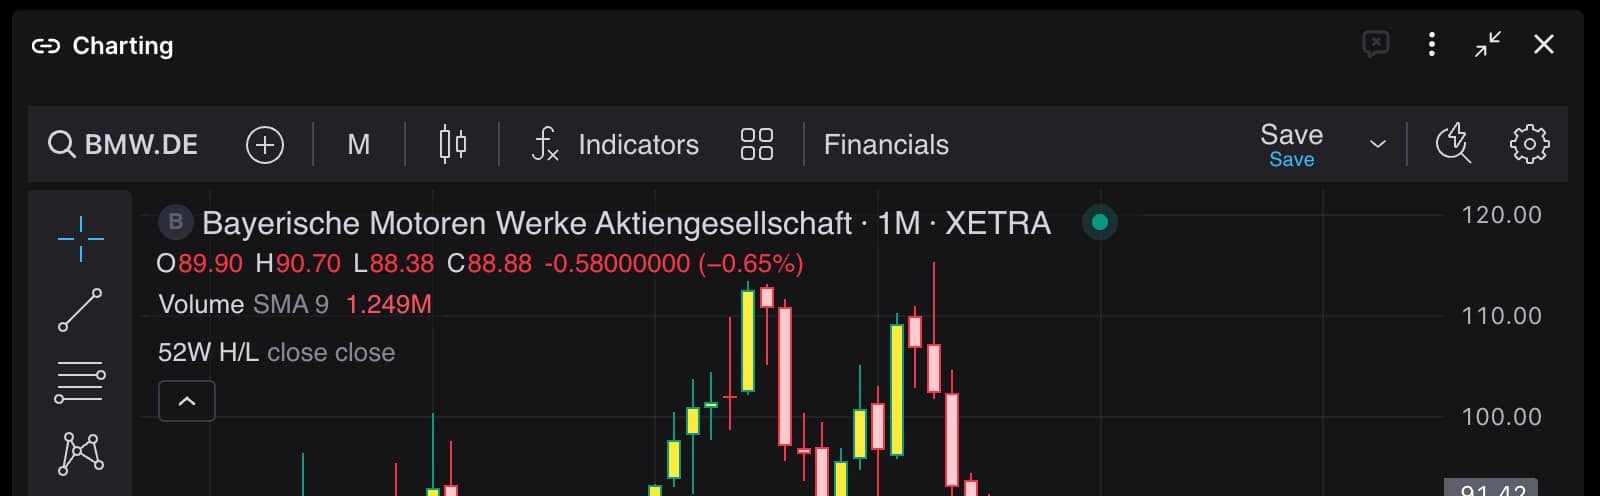
Chart widgets, particularly those using TradingView integration, provide sophisticated analytical tools including technical indicator overlays, and timeframe adjustments. Plotly charts allow to render any figure that is supported by Plotly.
How Widgets Work
Widgets operate on a simple yet powerful principle: they connect to data sources, apply your configurations, and render the results in real-time. Here's their data flow:
- Request: Widget queries the data source with your parameters
- Processing: Data sources prepare the data
- Delivery: Formatted data returns to the widget
- Rendering: Widget displays the information visually
- Interaction: You can interact with the data in the widget
Beyond this data flow, widgets exhibit two powerful features that transform them from simple displays into intelligent analytical tools.
Parameter linking creates synchronization across your dashboard. When widgets share parameter names, changing a ticker symbol or date range in one widget automatically updates all linked widgets.
AI-readable metadata exposes the widget metadata to AI agents so that they can interpret and act upon it. Unlike screen scraping, AI agents understand the underlying data source, parameter structure, and query methods for each widget. This understanding allows agents to dynamically request data with different parameters to answer your specific questions, accessing source datasets behind each widget rather than only the information that is currently displayed.
Controlling AI Visibility
Widgets support an optional ai configuration flag that controls whether a widget is exposed to AI agents.
- When
aiis set totrue, the widget’s metadata and parameters can be accessed by AI agents to dynamically request and analyze data. - When
aiis set tofalse, the widget will not be made available to AI workflows. This is useful for restricting access to sensitive, experimental, or internal-only widgets.
Example configuration:
{
  "paramName": "symbol",
  "type": "endpoint",
  "label": "Select Symbol",
  "optionsEndpoint": "/stock_search_options",
  "ai": false
}
This flag allows developers and analysts to explicitly control which widgets participate in AI-driven workflows within OpenBB Workspace.
Your Widget Library
OpenBB Workspace enables you to build a scalable library of widgets, instantly searchable and logically categorized to match your analytical workflow. This library centralizes your financial data visualizations, making them easily discoverable through search and category navigation.
Bring up the Widget Library search interface by either:
- Clicking the search field in the top left of the Workspace UI
- Pressing
Cmd+K(Mac) orCtrl+K(Windows) keyboard shortcut - Clicking the plus
+icon in the bottom right of any dashboard - Clicking the "Add Widget" button on any dashboard
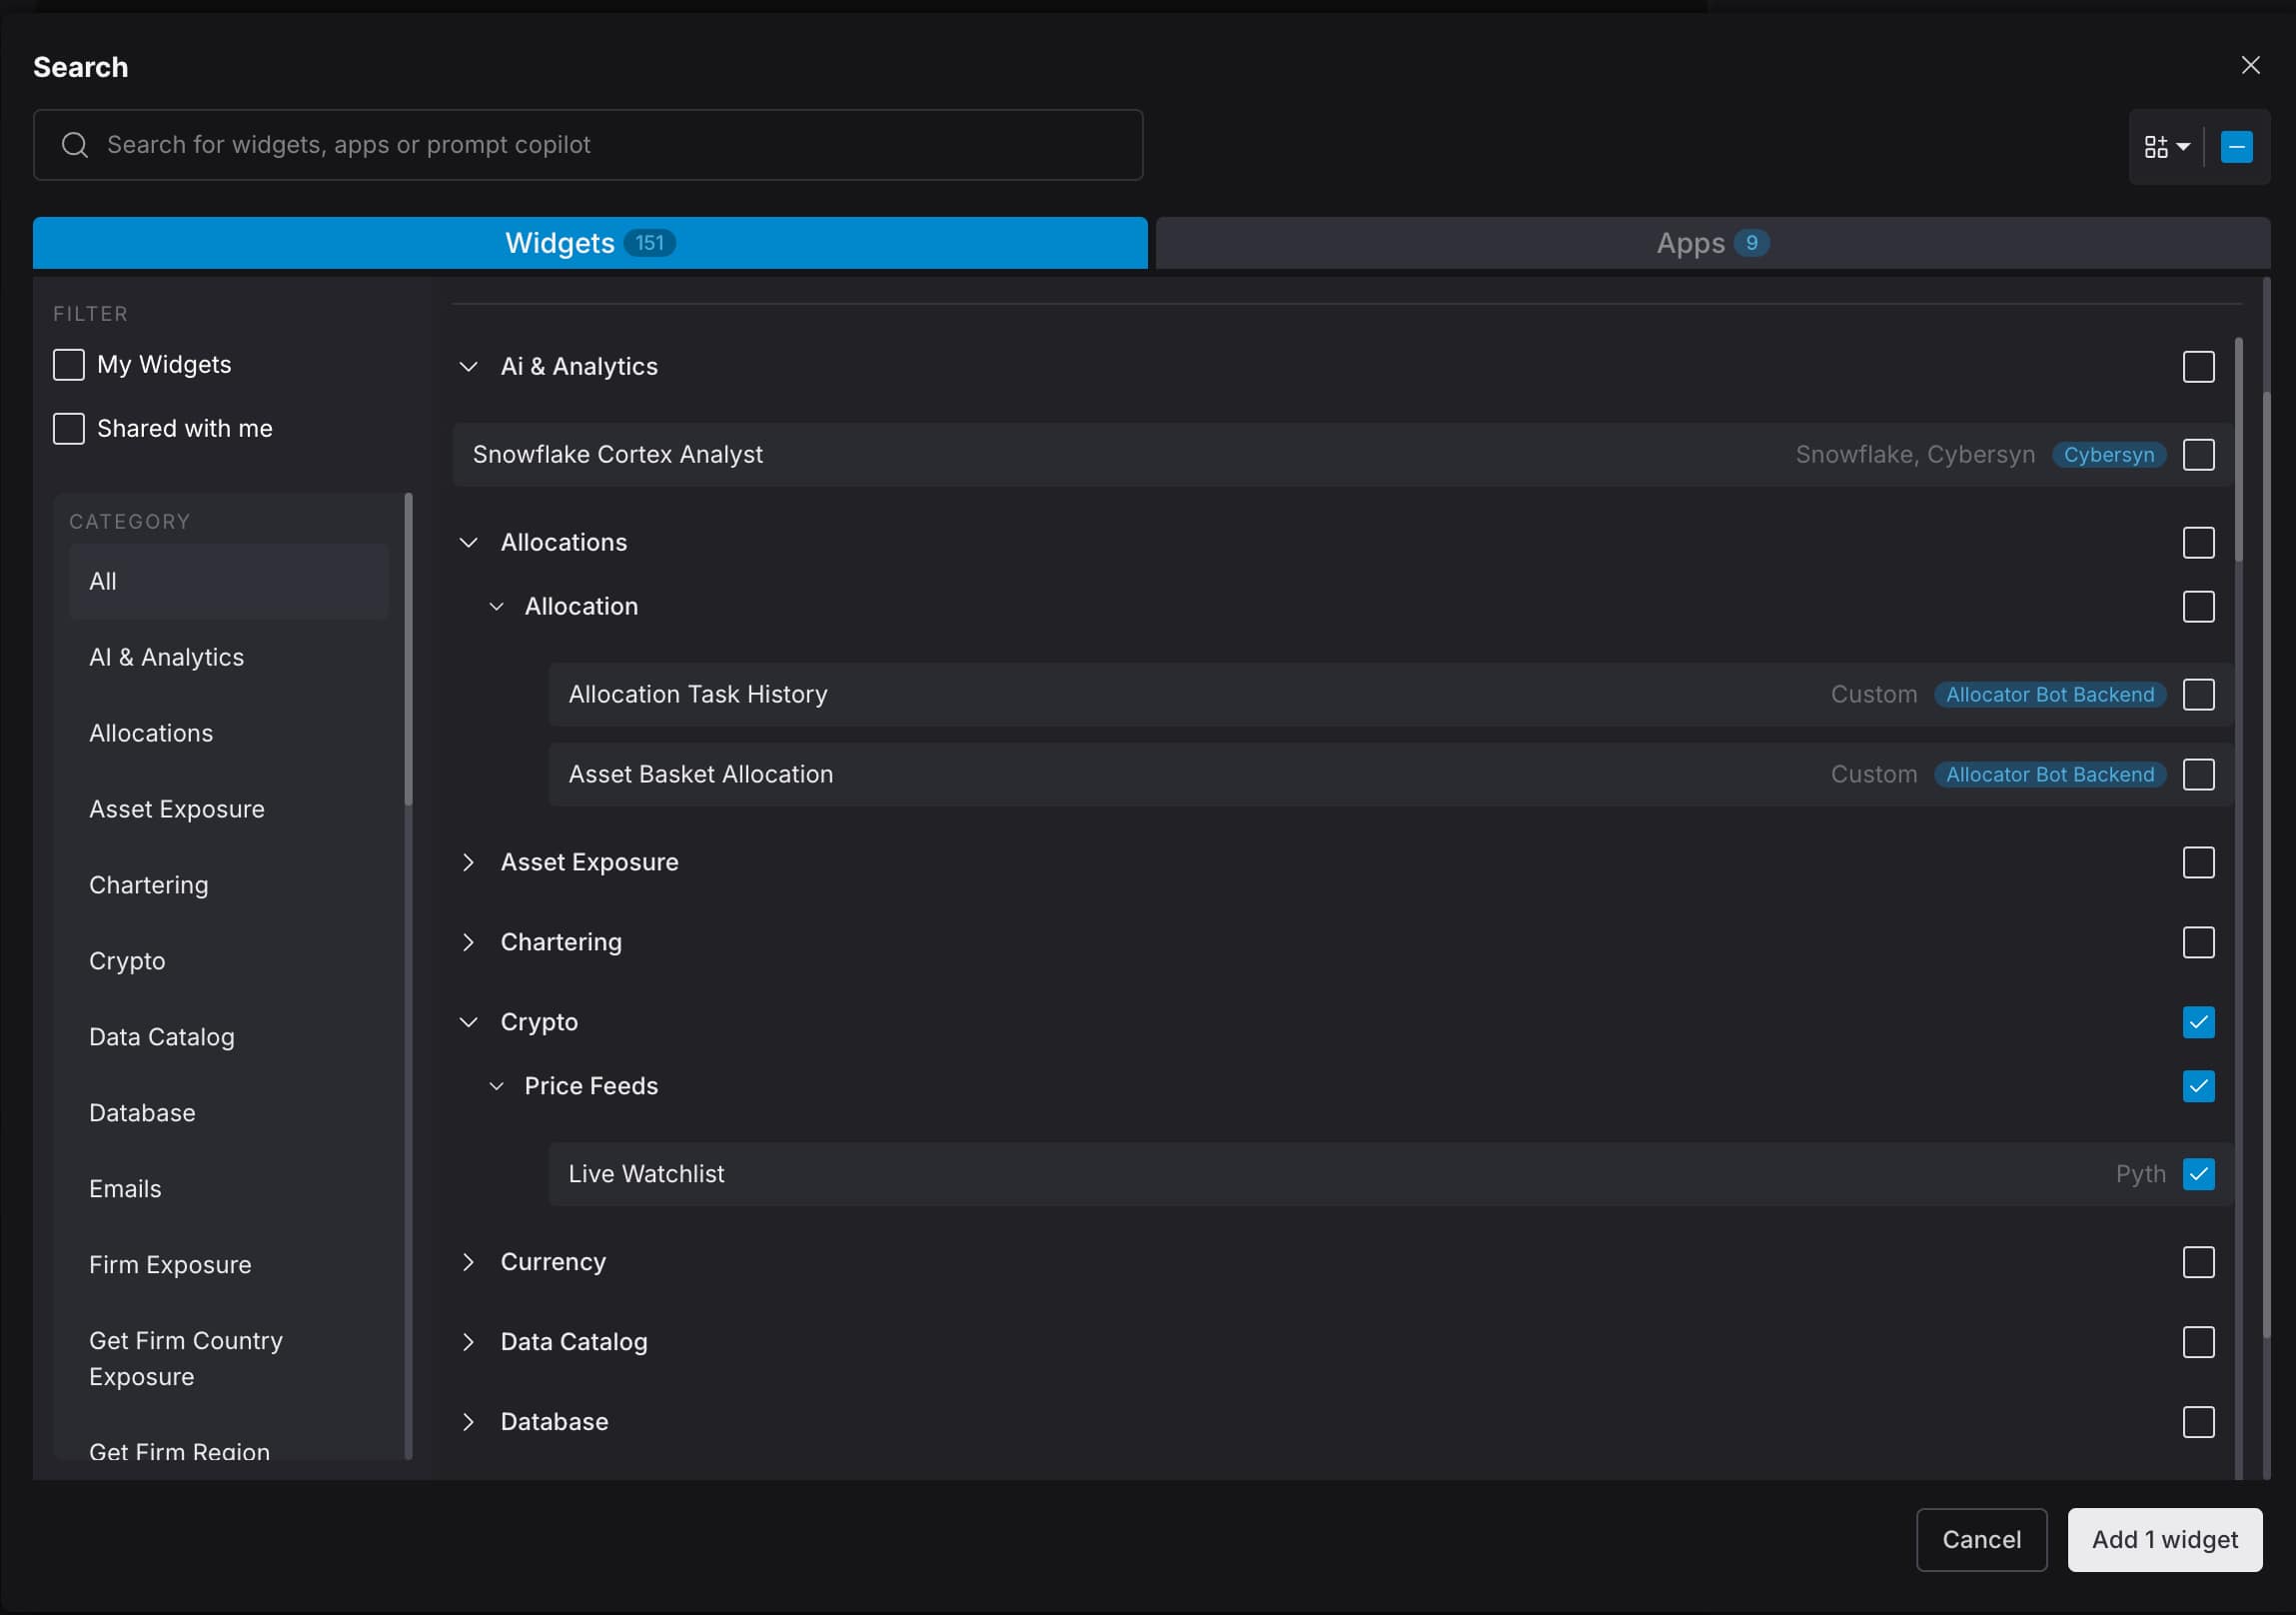
Widgets are grouped in ways that reflect real-world analytical workflows. Whether analyzing portfolios, tracking macro trends, or researching equities, relevant widgets are organized for quick access.
Example: Searching for an equity widget, for example, gives you immediate access to price data, fundamentals, options chains, and analyst estimates. For portfolio analysis, position tracking, performance attribution, and risk metrics are grouped together.
By organizing widgets through consistent metadata and categories, OpenBB Workspace reduces the time spent searching for data, allowing you to focus on analysis. The system supports new data sources and custom integrations while maintaining a clear structure that keeps thousands of widgets manageable and accessible.