Technical Analysis
The Technical Analysis menu offers the user a suite of tools for analyzing the technical components of an asset's trading history. The menu can be found in most wings of the Terminal:
The commands are divided by categories that define their purpose for general-use:
- Overlap - Moving averages
- Momentum - Oscillating signals
- Trend - Directional strength
- Volatility - Width of the price bands
- Volume - Singling out volume
- Custom - Multiple indicators and Fibonacci retracements
All commands in this menu will rely on the interval and window chosen when loading an asset for analysis. Refer to the directory tree on the left side of the page, here, for information on individual commands. To get a better understanding of what these features are, and the formulas behind them, a number of sources should be consulted; but, a good starting point is Investopedia. The menu employs the Pandas-TA Library. Submit a feature request to let us know which indicators we should add next!
How to Use
To begin, enter the menu from one of the menus listed above by entering ta. For demonstration purposes, we will use QQQ as the ticker. Let's grab some data!
/stocks/load QQQ/ta
The block above loads daily QQQ historical prices and volume, then enters the Technical Analysis menu. The table below lists all the available analysis functions.
| Function Key | Type | Description |
|---|---|---|
| load | - | Load a new ticker for analysis. |
| ema | Overlap | Exponential Moving Average. |
| hma | Overlap | Hull Moving Average. |
| sma | Overlap | Simple Moving Average. |
| wma | Overlap | Weighted Moving Average. |
| vwap | Overlap | Volume Weighted Average Price. |
| zlma | Overlap | Zero-Lag Moving Average. |
| cci | Momentum | Commodity Channel Index. |
| cg | Momentum | Center of Gravity. |
| clenow | Momentum | Clenow Volatility Adjusted Momentum. |
| demark | Momentum | Tom Demark's Sequential Indicator. |
| macd | Momentum | Moving Average Convergence/Divergence. |
| fisher | Momentum | Fisher Transform. |
| rsi | Momentum | Relative Strength Index. |
| stoch | Momentum | Stochastic Oscillator. |
| adx | Trend | Average Directional Movement Index. |
| aroon | Trend | Aroon Indicator. |
| atr | Volatility | Average True Range. |
| bbands | Volatility | Bollinger Bands. |
| cones | Volatility | Realized Volatility Cones. |
| donchian | Volatility | Donchian Channels. |
| kc | Volatility | Keltner Channels. |
| ad | Volume | Accumulation/Distribution Line. |
| adosc | Volume | Chaikin Oscillator. |
| obv | Volume | On-Balance Volume. |
| fib | Custom | Fibonacci Retracement. |
| multi | Custom | Plot multiple indicators on the same chart. |
Some functions will not be compatible with intraday data and some may be designed specifically for a daily window. Interval labels on charts may still be described as "days" when the time series interval is intraday. Consult the help dialogue, by attaching -h to a command, for a reminder of the adjustable parameters.
With some daily data now loaded, let's look at some charts!
Examples
Moving Averages
There are five types of moving averages available, they are grouped into the Overlay category. It is possible to overlay multiple windows of time for each one, and it is also possible to overlay multiple versions of moving average.
Single MA Type
The help dialogue will explain the differences. For example, Zero-Lag Moving Average.
zlma -h
usage: zlma [-l N_LENGTH] [-o N_OFFSET] [-h] [--export EXPORT] [--sheet-name SHEET_NAME [SHEET_NAME ...]]

The zero lag exponential moving average (ZLEMA) indicator was created by John Ehlers and Ric Way. The idea is do a regular exponential moving average (EMA) calculation but
on a de-lagged data instead of doing it on the regular data. Data is de-lagged by removing the data from "lag" days ago thus removing (or attempting to) the cumulative
effect of the moving average.

options:
  -l N_LENGTH, --length N_LENGTH
                        Window lengths. Multiple values indicated as comma separated values. (default: [20])
  -o N_OFFSET, --offset N_OFFSET
                        offset (default: 0)
  -h, --help            show this help message (default: False)
  --export EXPORT       Export raw data into csv, json, xlsx and figure into png, jpg, pdf, svg (default: )
  --sheet-name SHEET_NAME [SHEET_NAME ...]
                        Name of excel sheet to save data to. Only valid for .xlsx files. (default: None)

For more information and examples, use 'about zlma' to access the related guide.
For moving averages, there are two parameters: the window length and offset. Let's examine the ZLMA at 50 and 200 days.
zlma -l 50,200
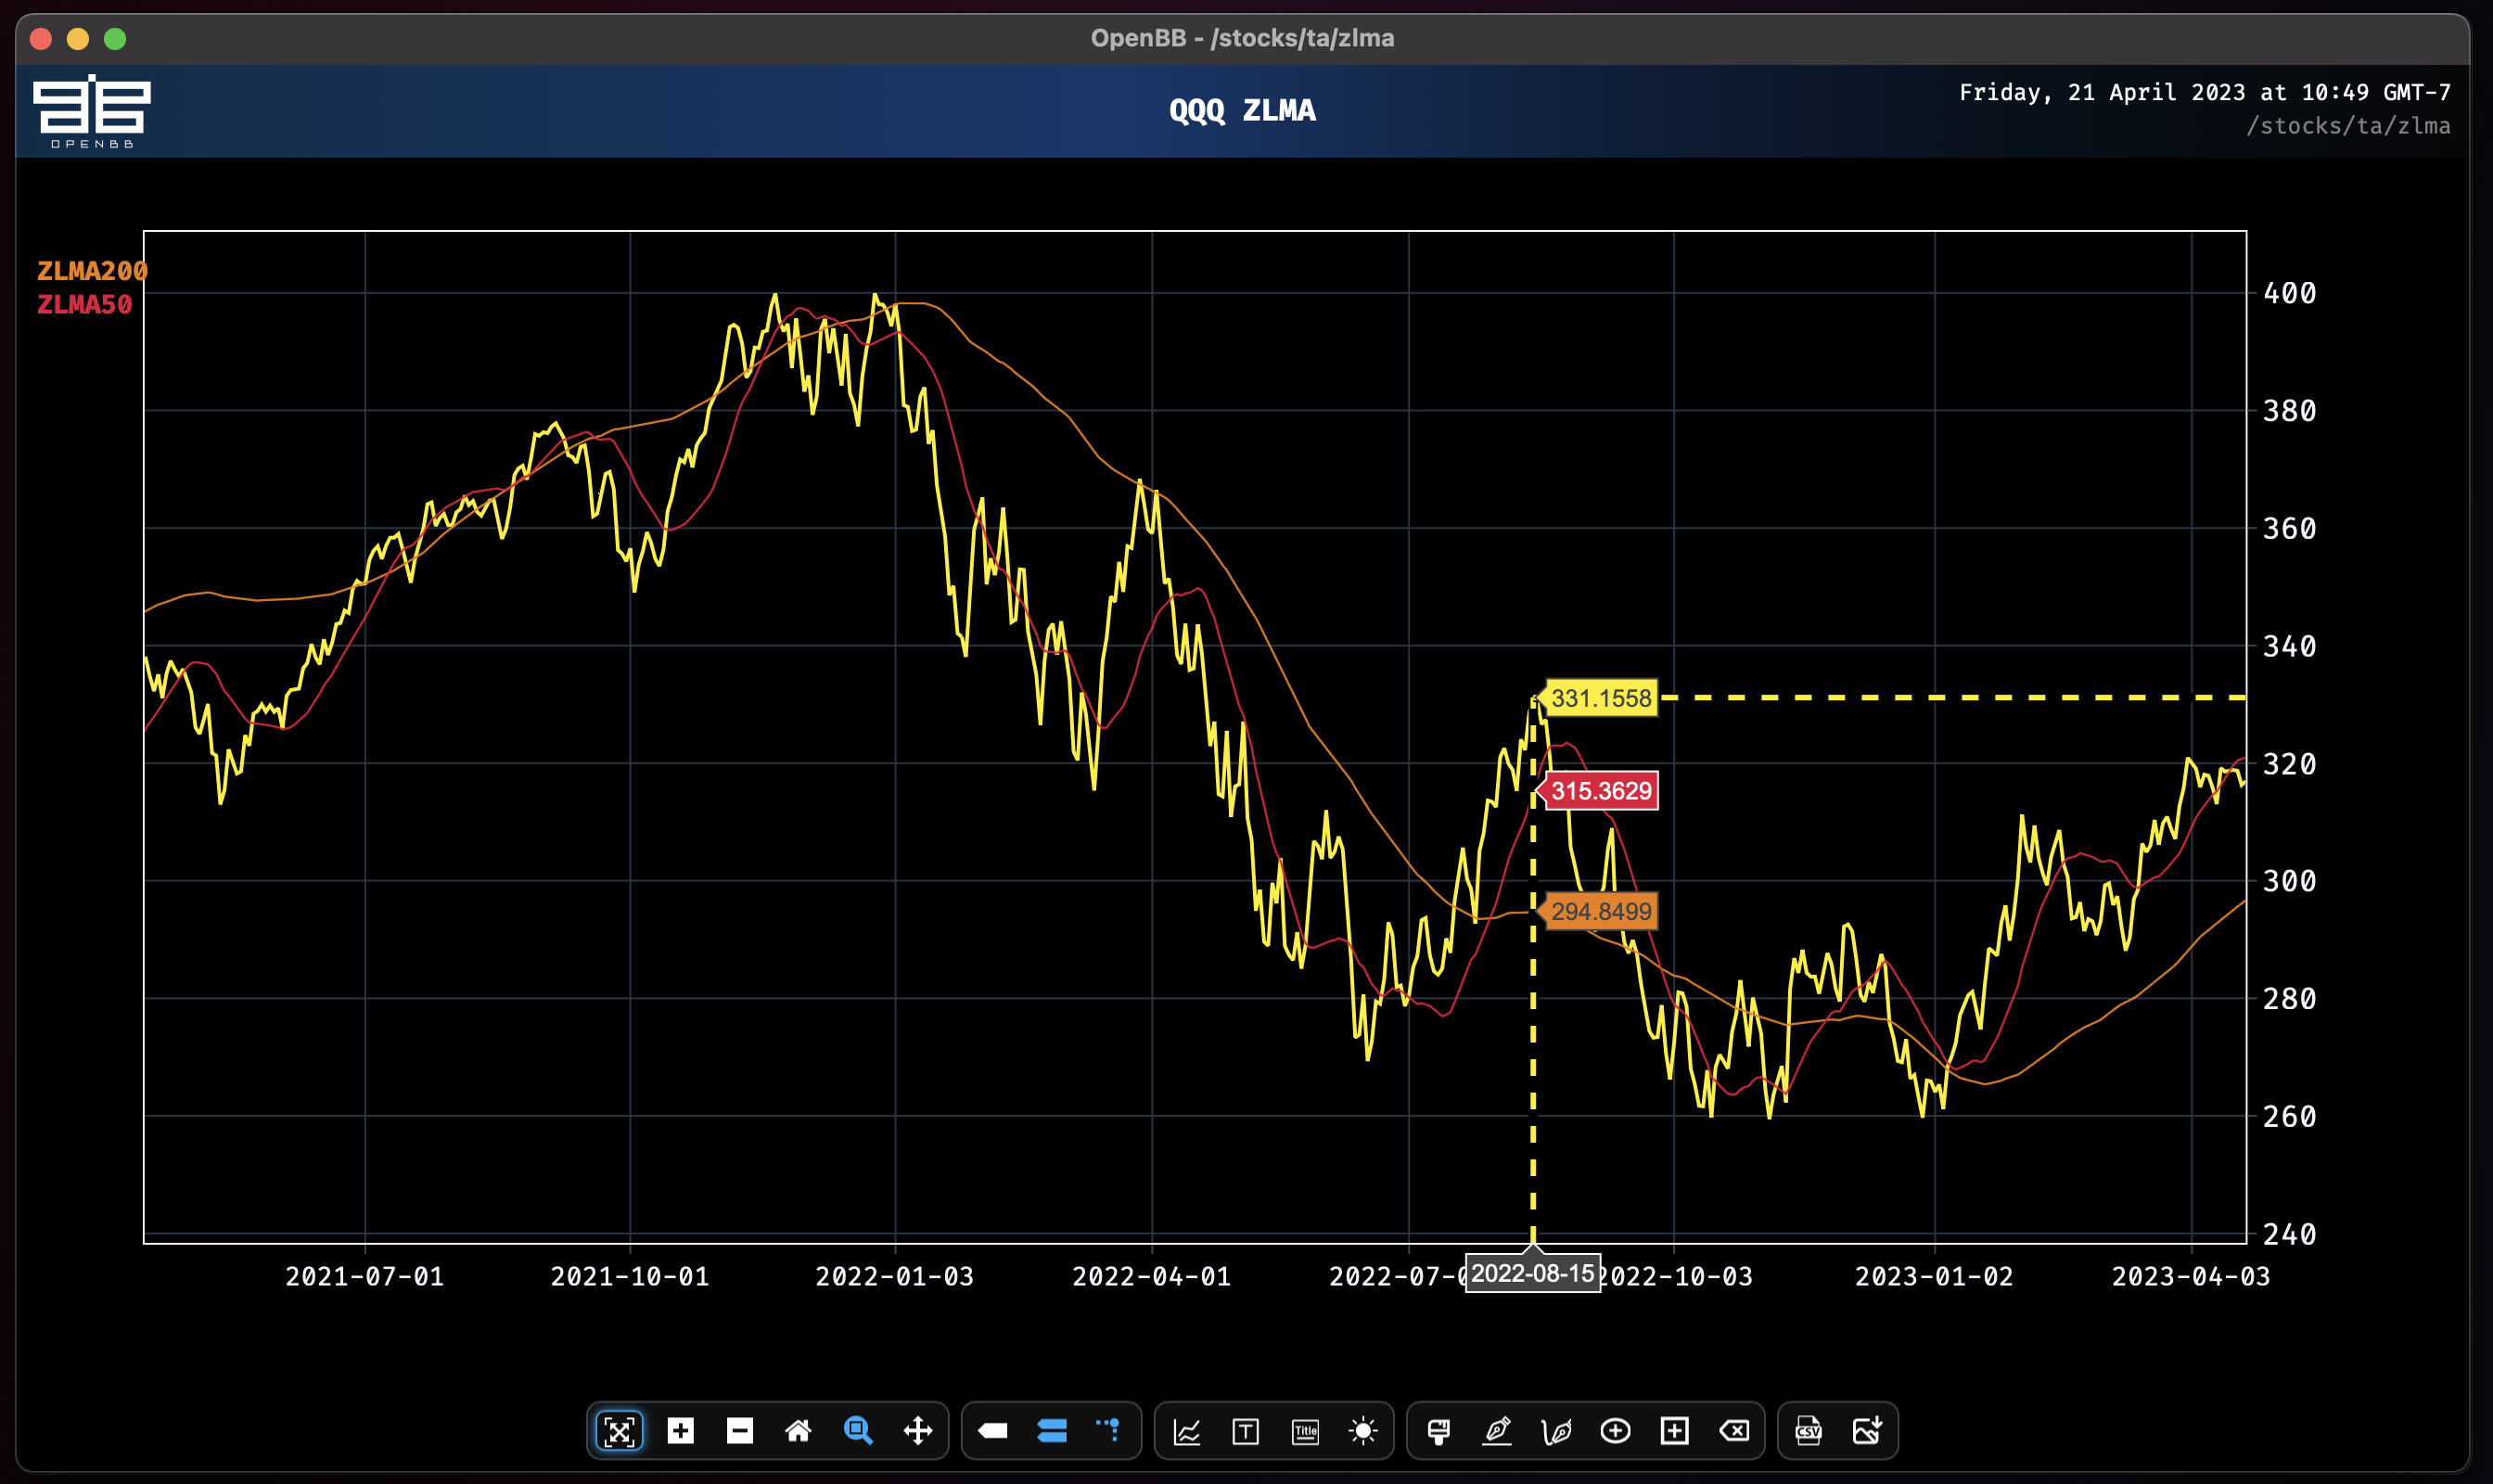
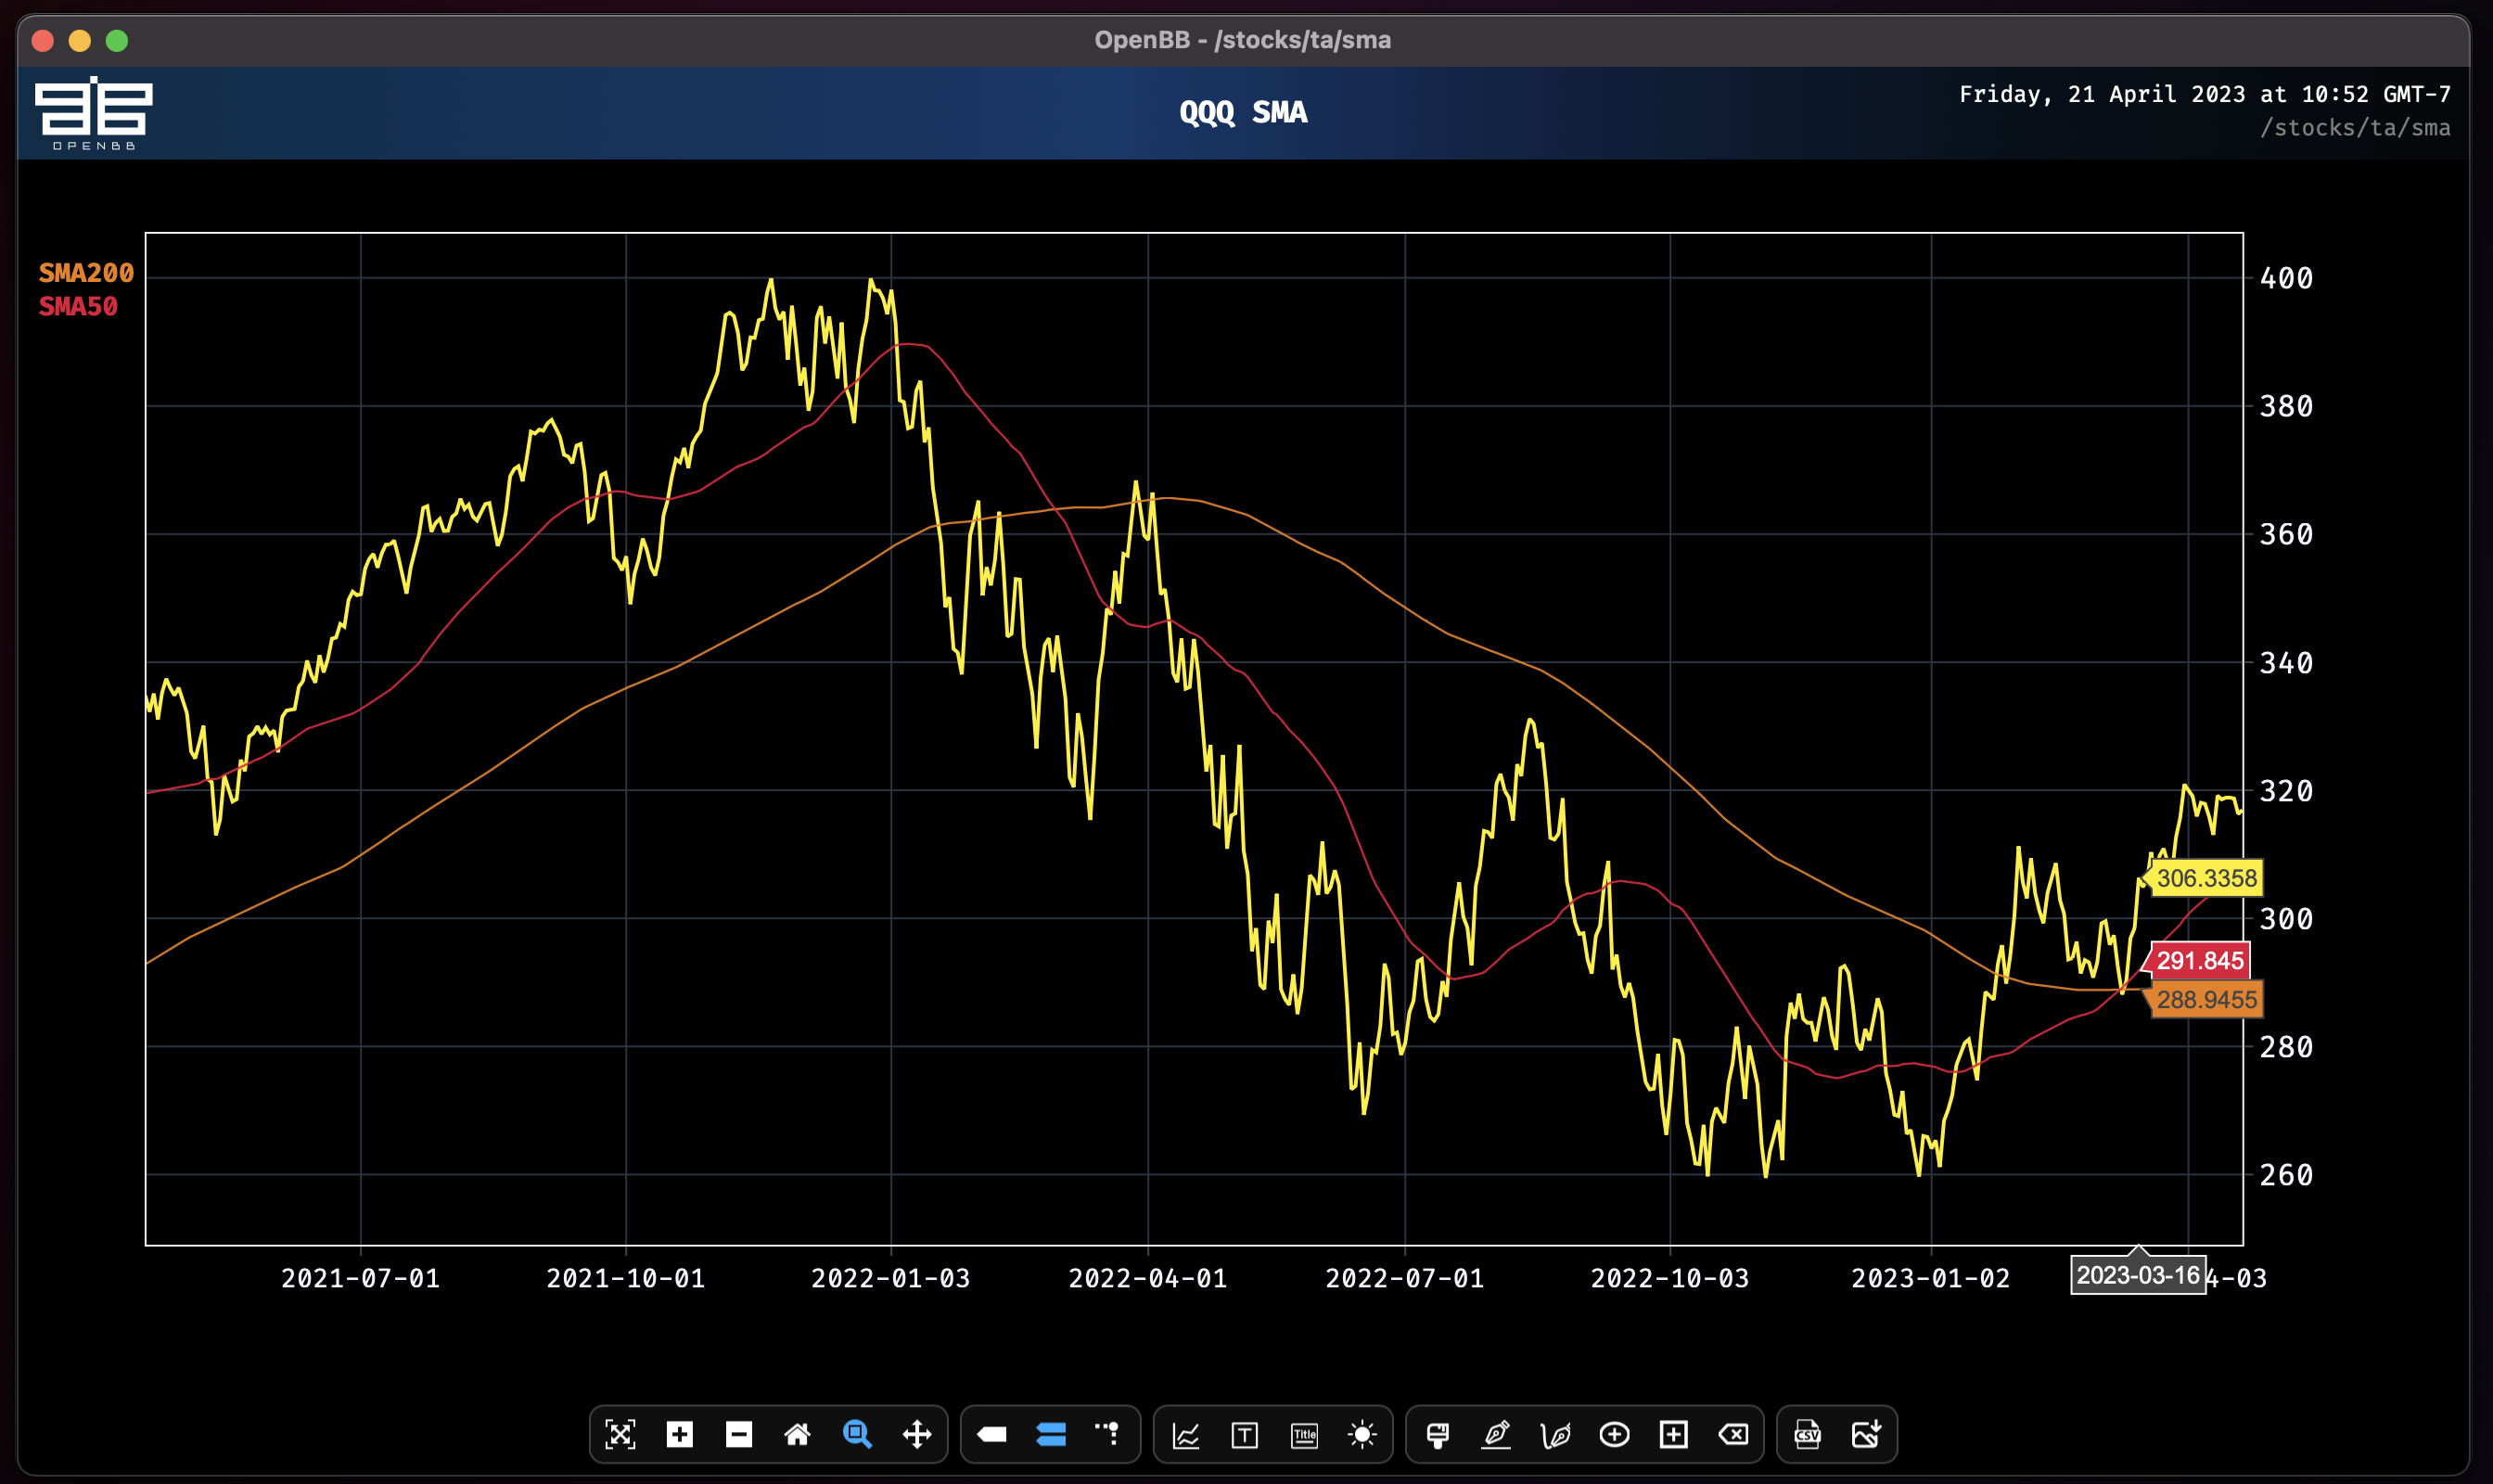
Drawing a chart with the Simple Moving Average shows the overlaps occur at different points in time.
sma -l 50,200
Multiple MA Types
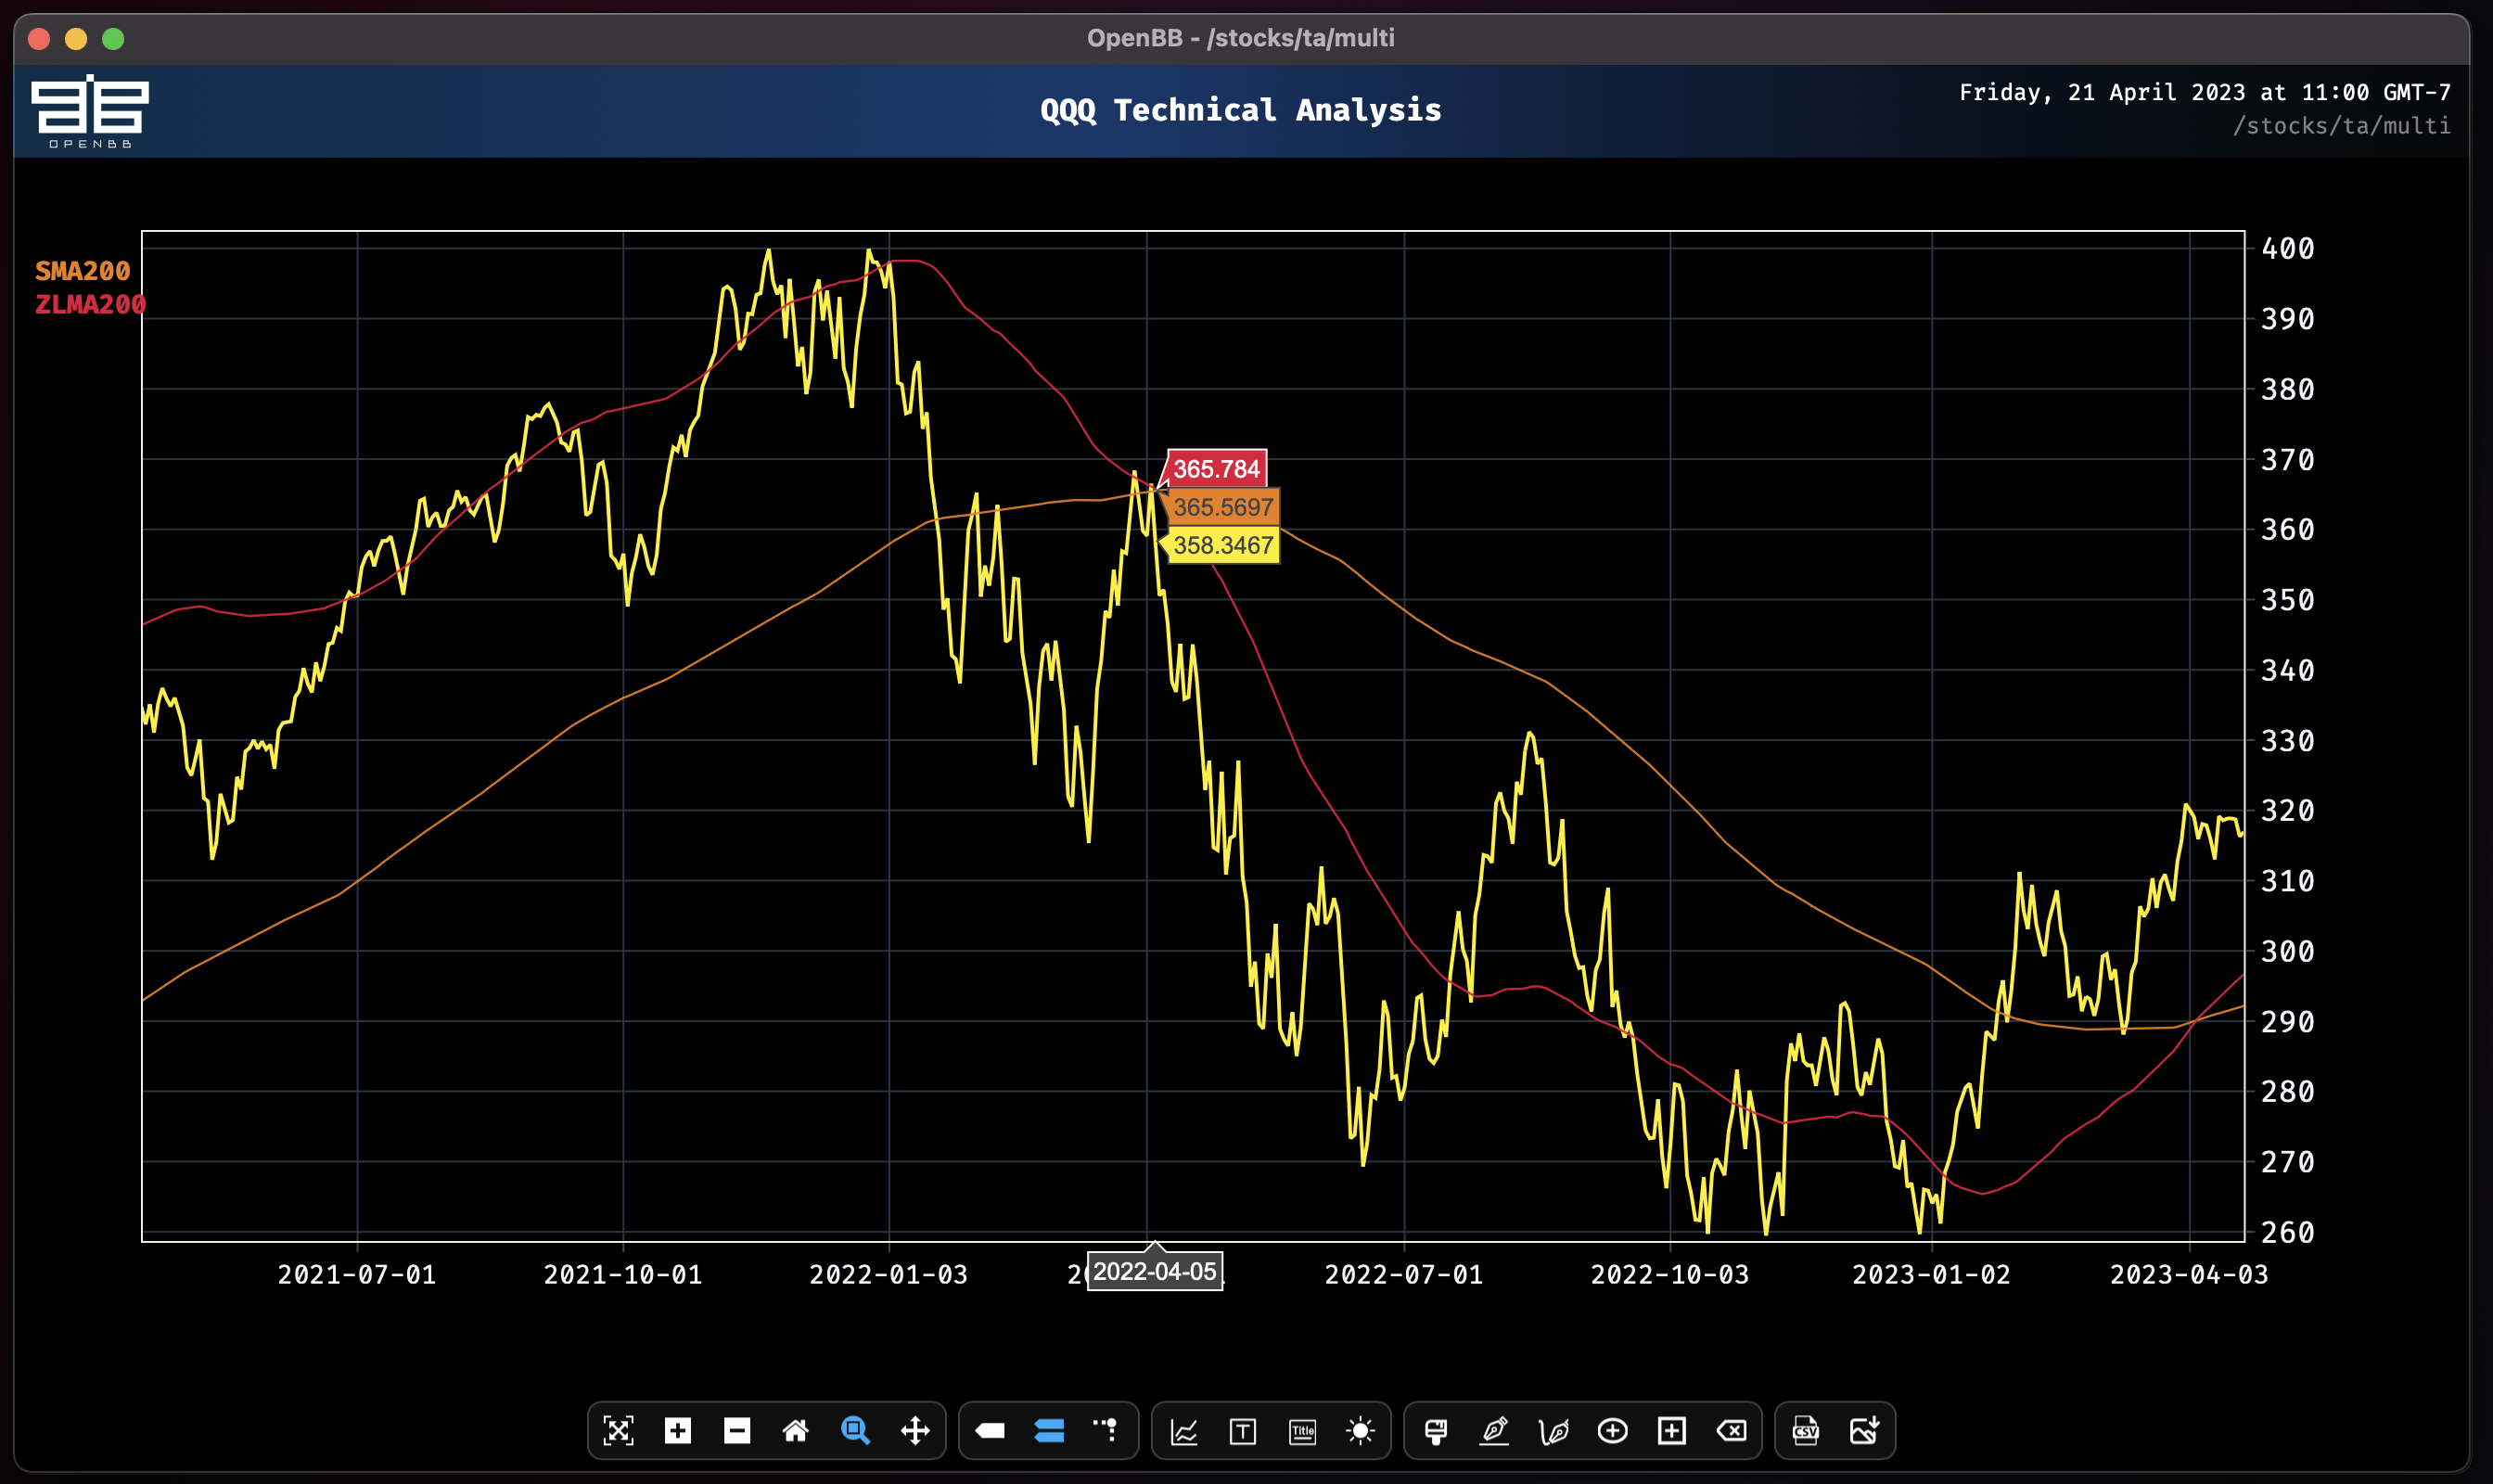
Let's overlay the 200-day ZLMA with the 200-day SMA to see where they intersect. This is accomplished using the multi function.
multi -i sma[200],zlma[200]
Make note of the difference in parameters syntax. With the multi function, parameters for each indicator must be surrounded with square brackets [ ].
Now let's see both 200 and 50-day moving averages.
multi -i sma[50,200],zlma[50,200]
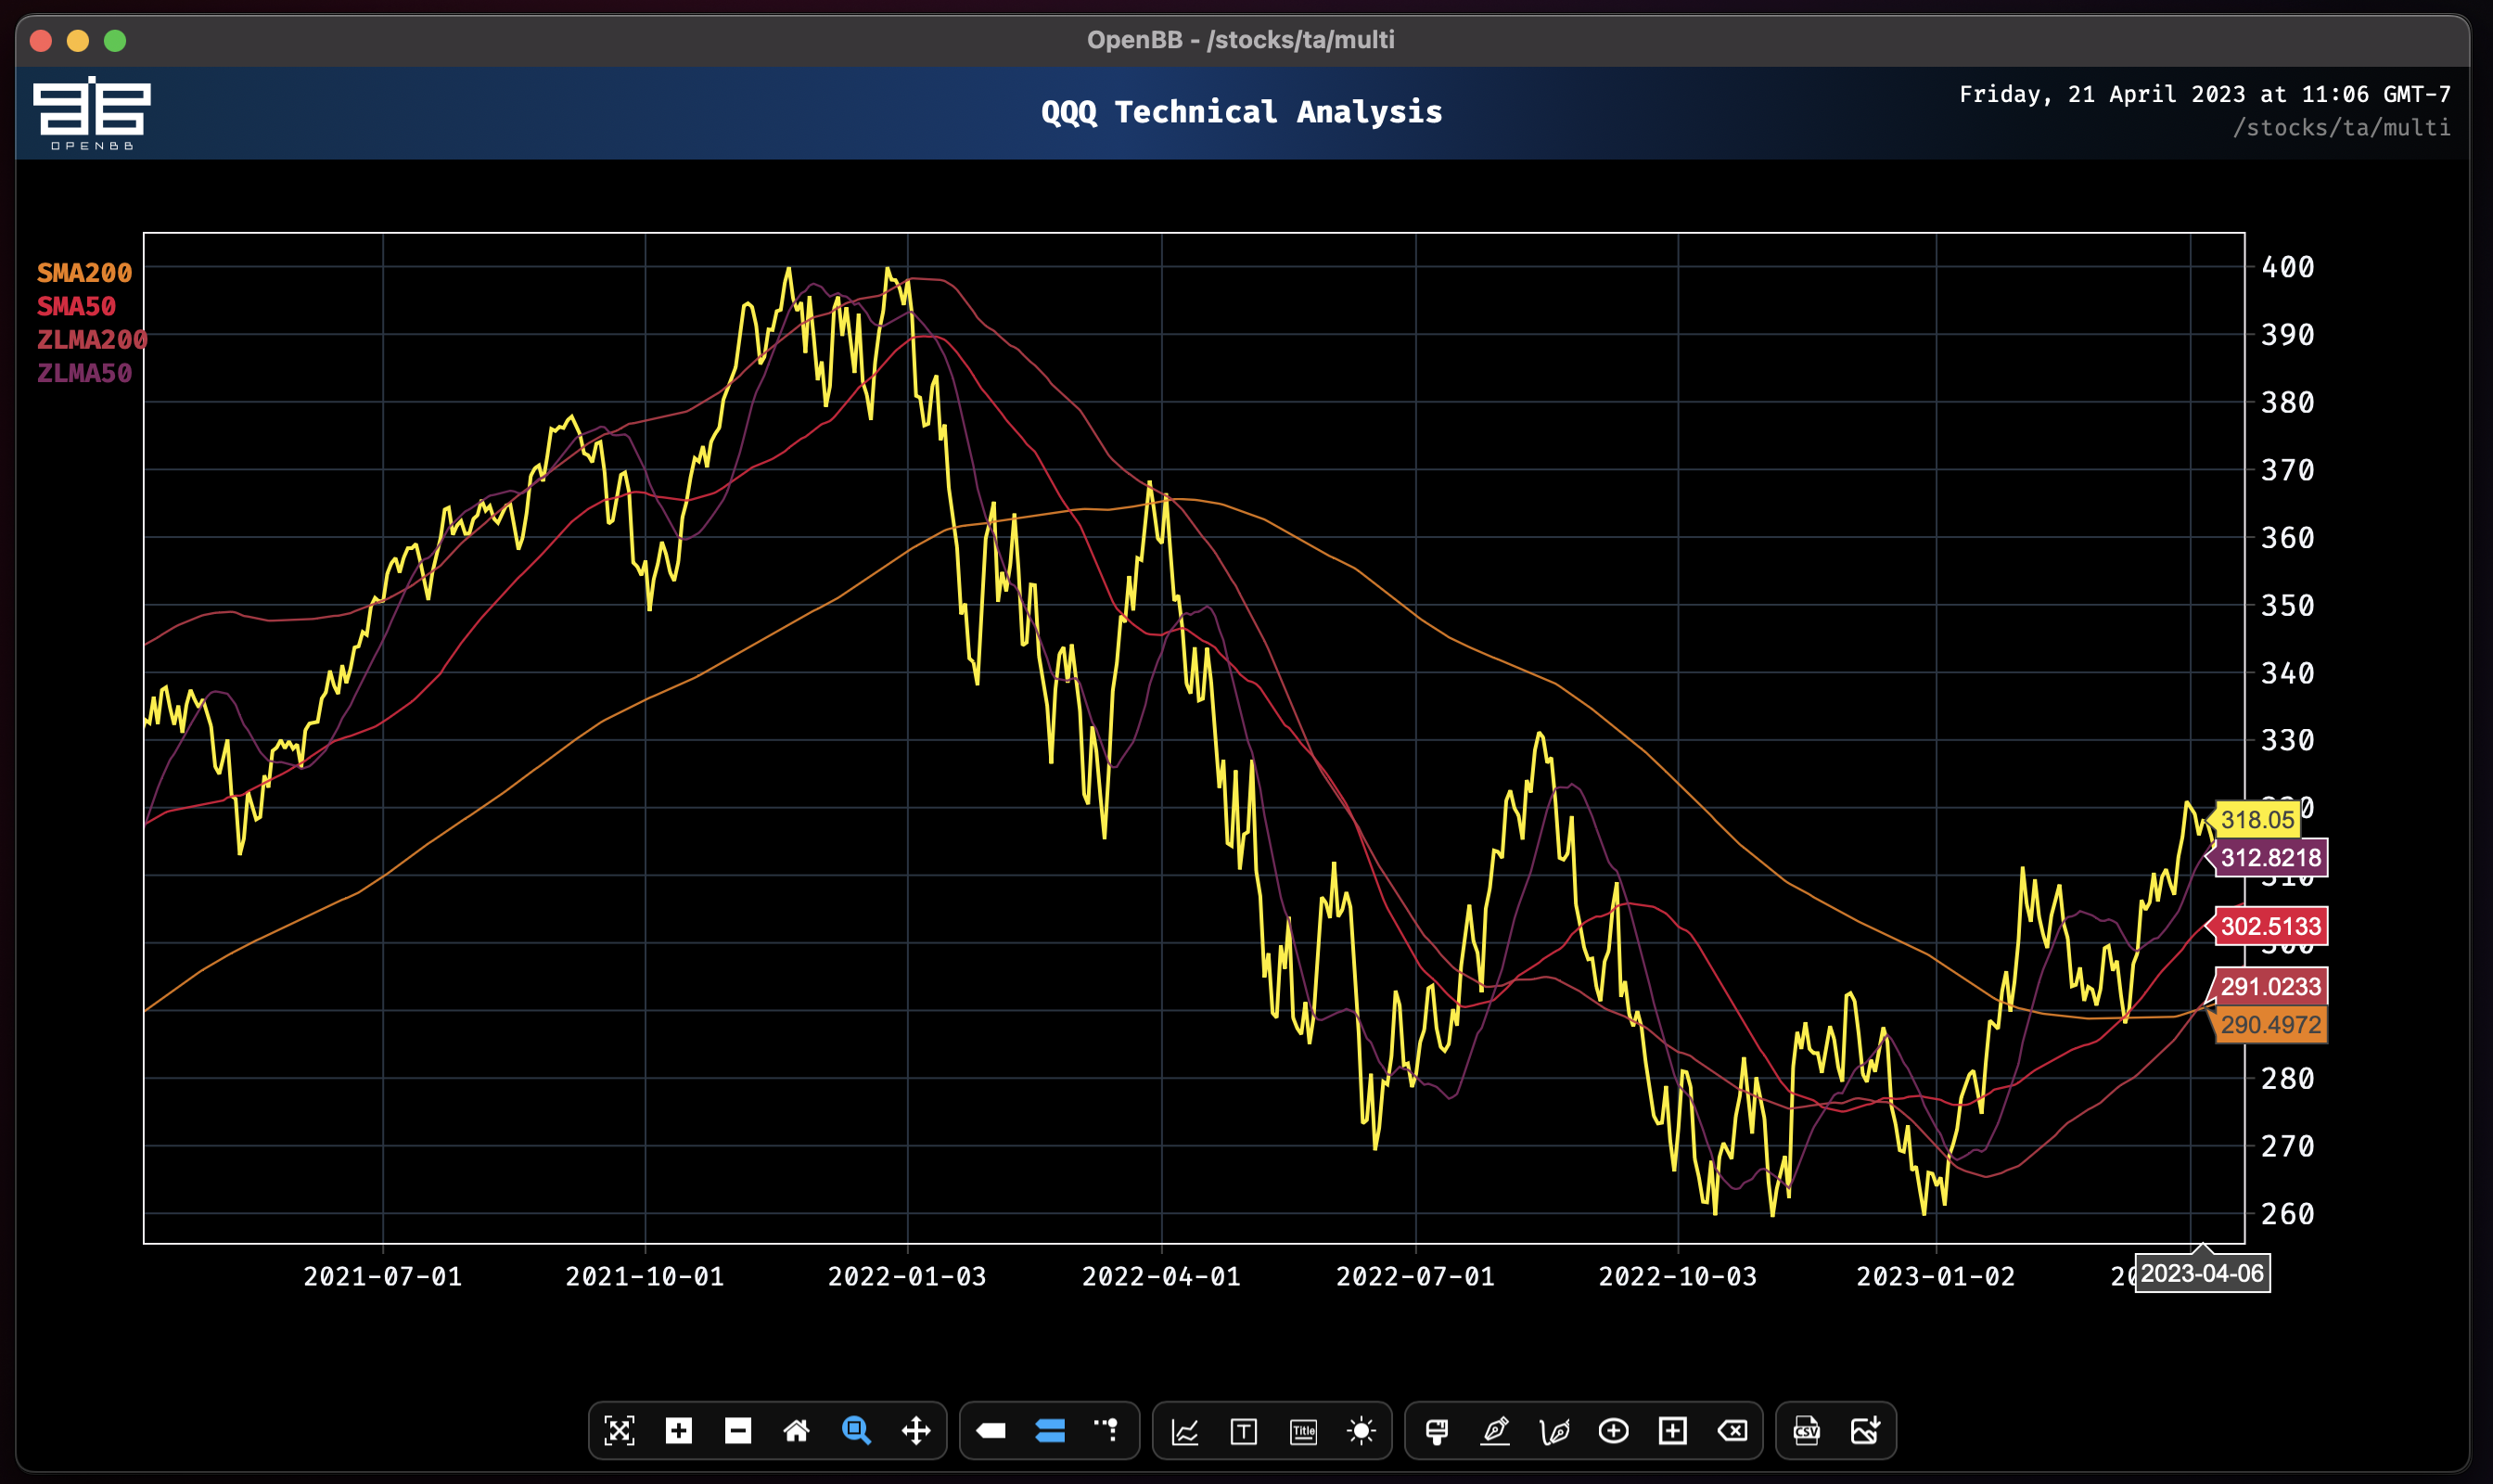
The last crossover point provides some confirmation of the current trend. Intraday data might reveal more. Let's see the one-hour MAs!
load qqq -i 60/multi -i sma[50,200],zlma[50,200]
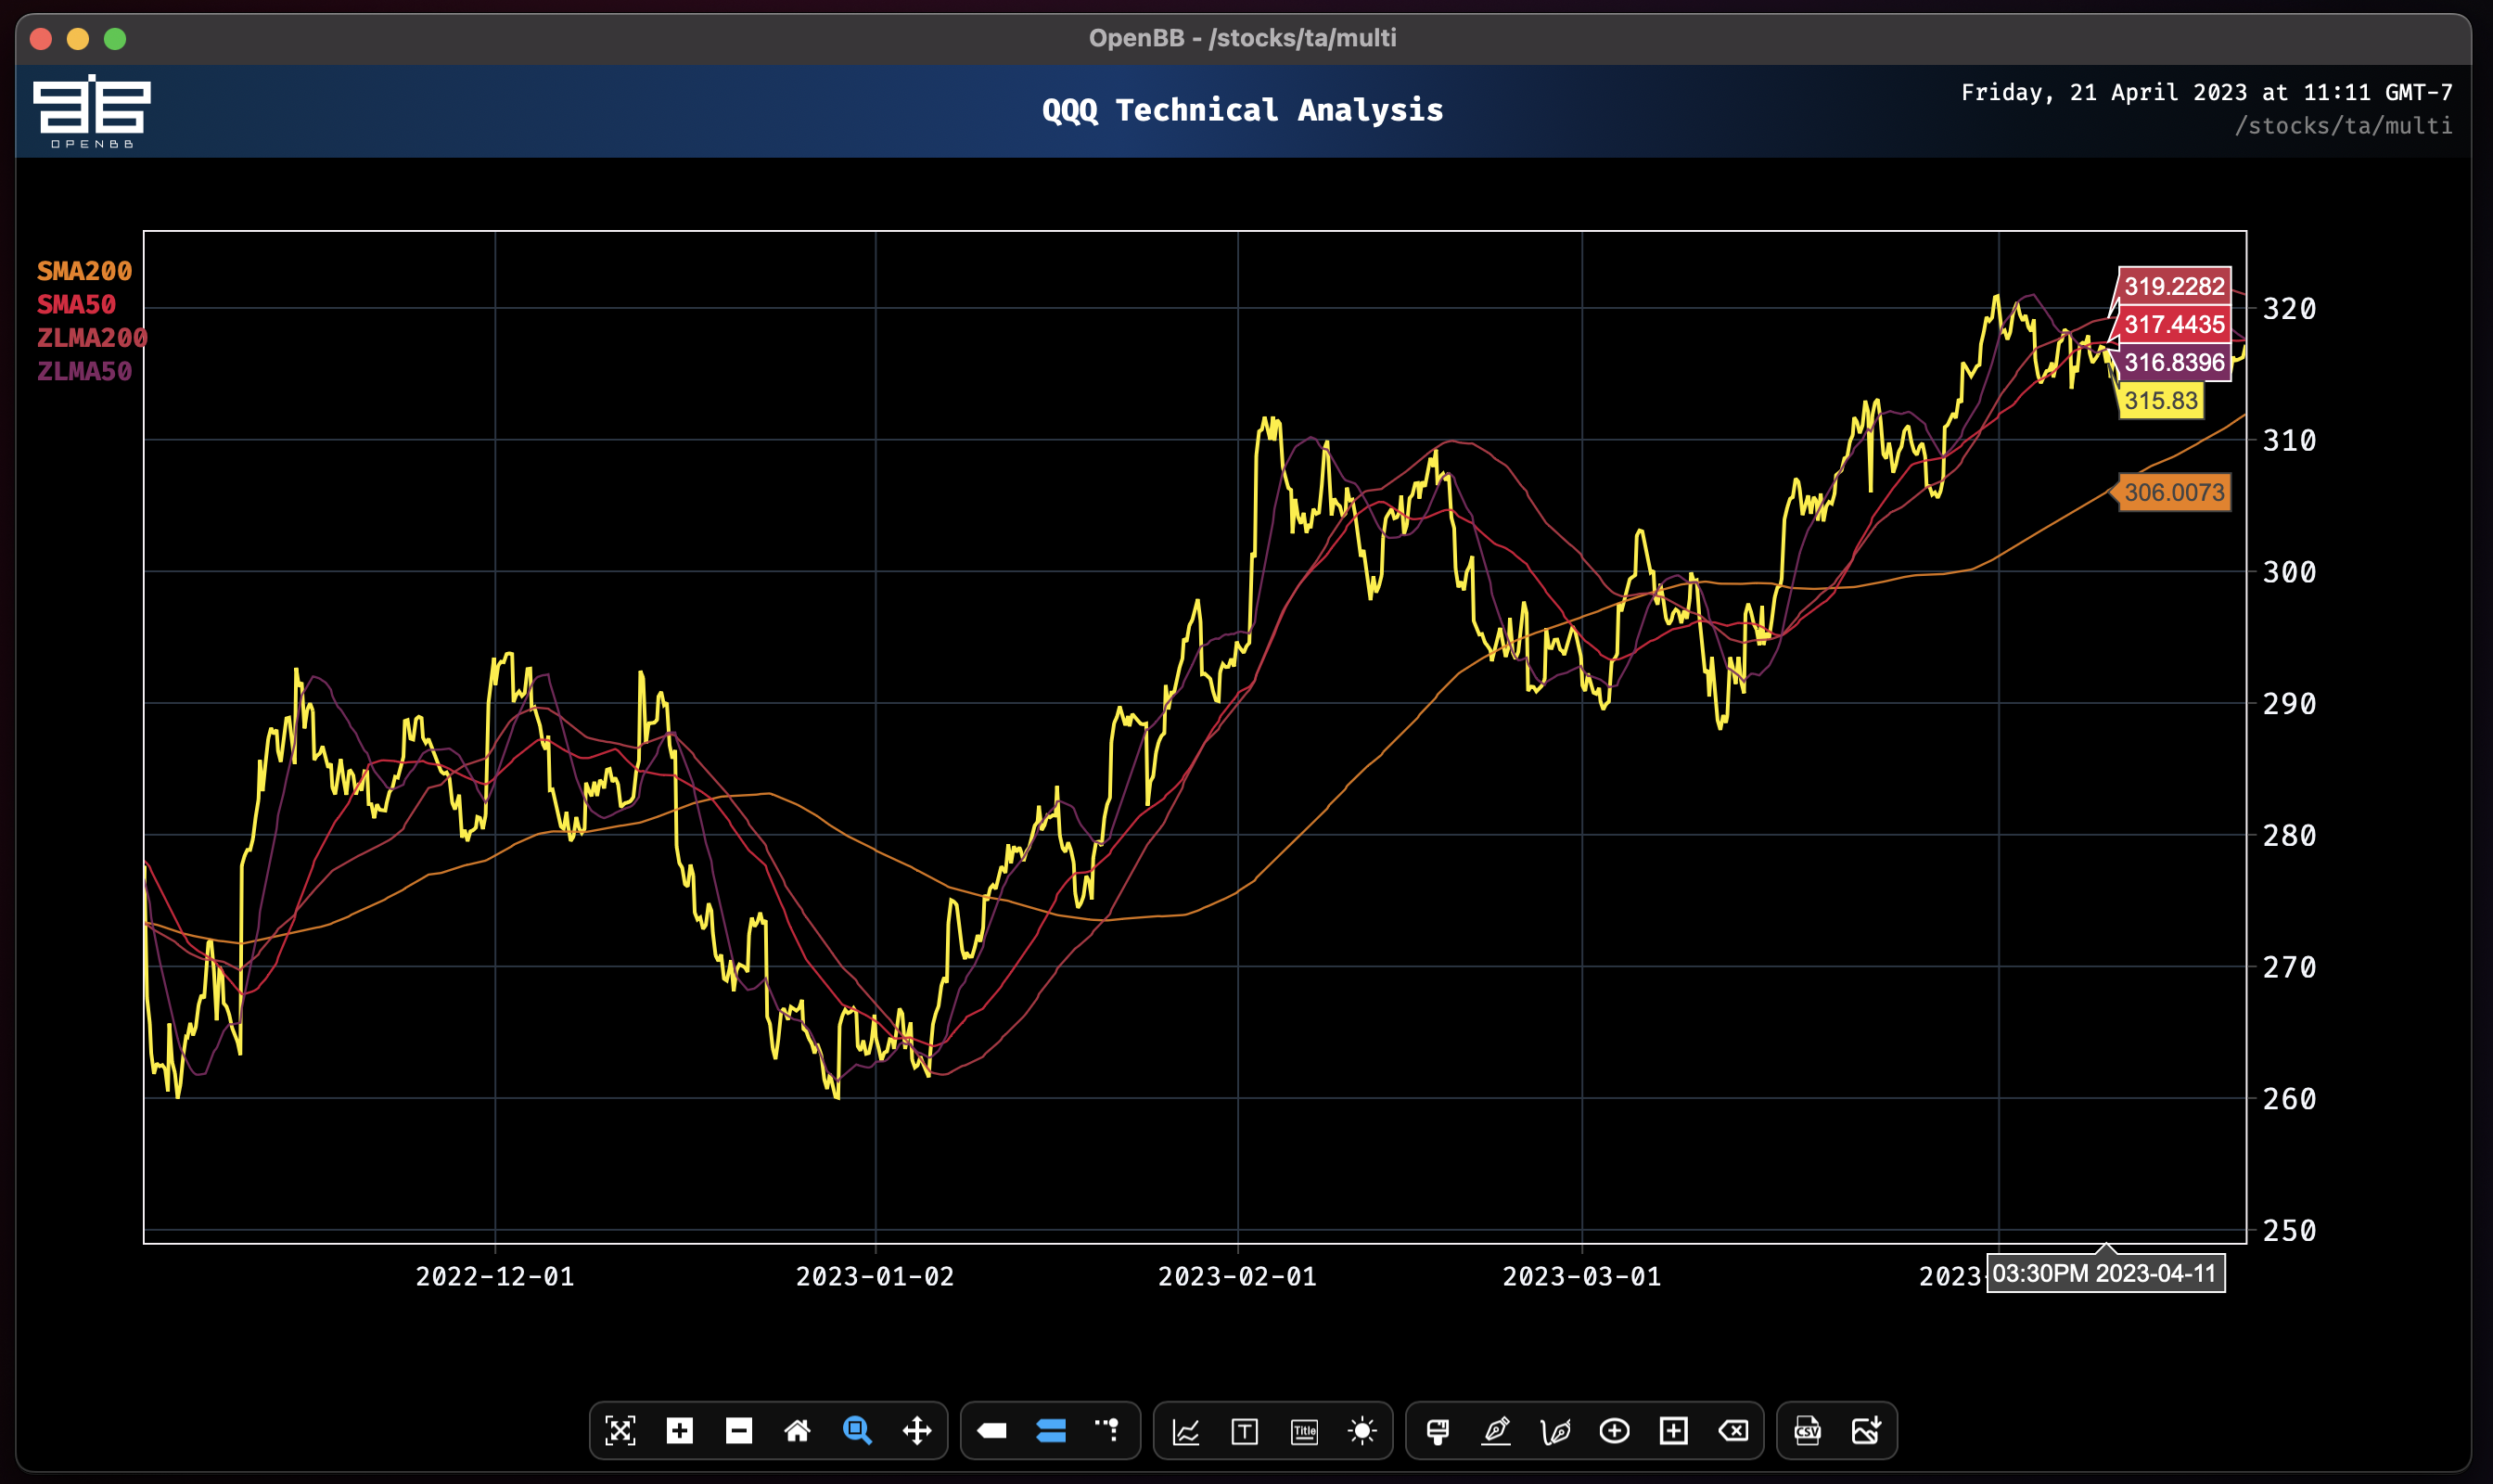
The ZLMA 50 has crossed over the SMA50, potentially signalling that the trend is near its exhaustion point. Let's consult some other indicators using the hourly data now loaded.
multi
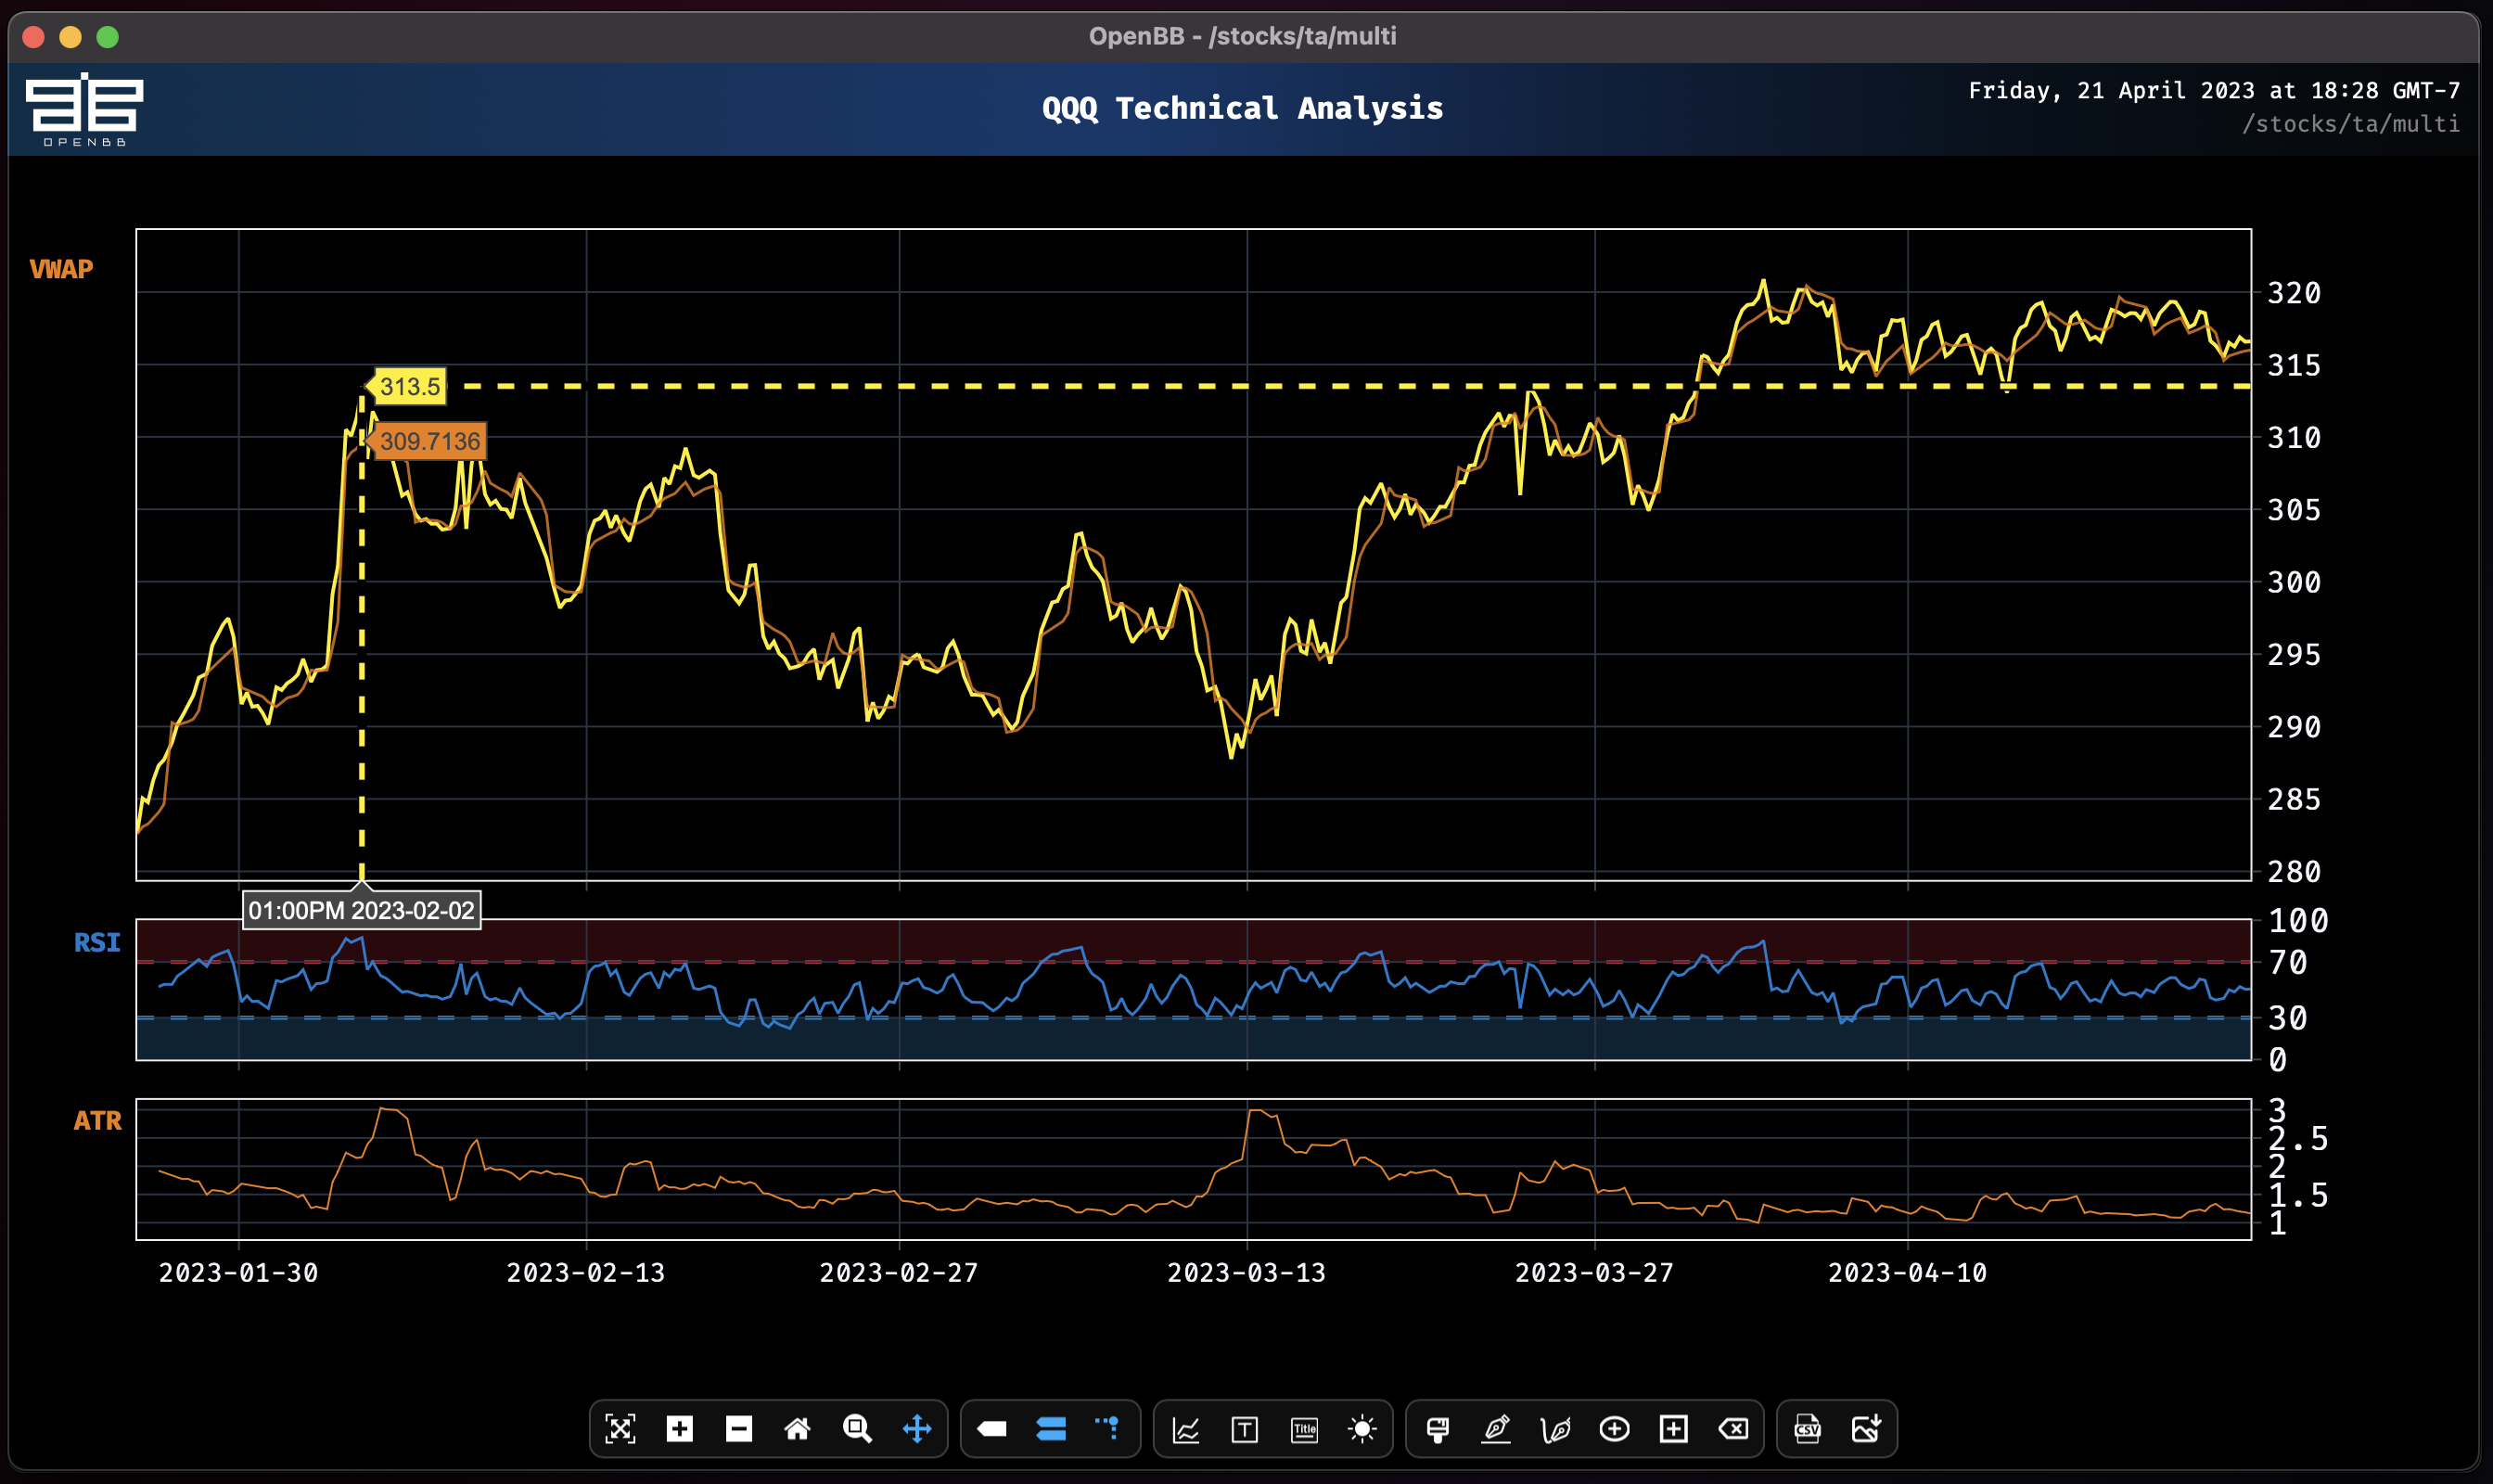
Load multiple indicators on the same chart with the multi command.
load qqq -i 60 -s 2023-01-01/multi rsi,vwap,atr
The help dialogue for this function provides some guidance for setting the optional arguments for each indicator.
multi -h
usage: multi [-i INDICATORS] [-h] [--export EXPORT] [--sheet-name SHEET_NAME [SHEET_NAME ...]]

Plot multiple indicators on the same chart separated by a comma.

options:
  -i INDICATORS, --indicators INDICATORS
                        Indicators with optional arguments in the form of "macd[12,26,9],rsi,sma[20]" (default: None)
  -h, --help            show this help message (default: False)
  --export EXPORT       Export raw data into csv, json, xlsx and figure into png, jpg, pdf, svg (default: )
  --sheet-name SHEET_NAME [SHEET_NAME ...]
                        Name of excel sheet to save data to. Only valid for .xlsx files. (default: None)

For more information and examples, use 'about multi' to access the related guide.
Making adjustments with this function requires knowing the parameters for each individual indicator. They will have sensible default values but, where there are multiple parameters, it may not be obvious which order the numbers need to be entered. Sometimes they are not even numbers, like MACD.
macd
macd --help

(🦋) /stocks/ta/ $ macd --help

usage: macd [--fast N_FAST] [--slow N_SLOW] [--signal N_SIGNAL] [-h] [--export EXPORT] [--sheet-name SHEET_NAME [SHEET_NAME ...]]

The Moving Average Convergence Divergence (MACD) is the difference between two Exponential Moving Averages. The Signal line is an Exponential Moving
Average of the MACD. The MACD signals trend changes and indicates the start of new trend direction. High values indicate overbought conditions, low
values indicate oversold conditions. Divergence with the price indicates an end to the current trend, especially if the MACD is at extreme high or low
values. When the MACD line crosses above the signal line a buy signal is generated. When the MACD crosses below the signal line a sell signal is
generated. To confirm the signal, the MACD should be above zero for a buy, and below zero for a sell.

options:
  --fast N_FAST         The short period. (default: 12)
  --slow N_SLOW         The long period. (default: 26)
  --signal N_SIGNAL     The signal period. (default: 9)
  -h, --help            show this help message (default: False)
  --export EXPORT       Export raw data into csv, json, xlsx and figure into png, jpg, pdf, svg (default: )
  --sheet-name SHEET_NAME [SHEET_NAME ...]
                        Name of excel sheet to save data to. Only valid for .xlsx files. (default: None)

For more information and examples, use 'about macd' to access the related guide.
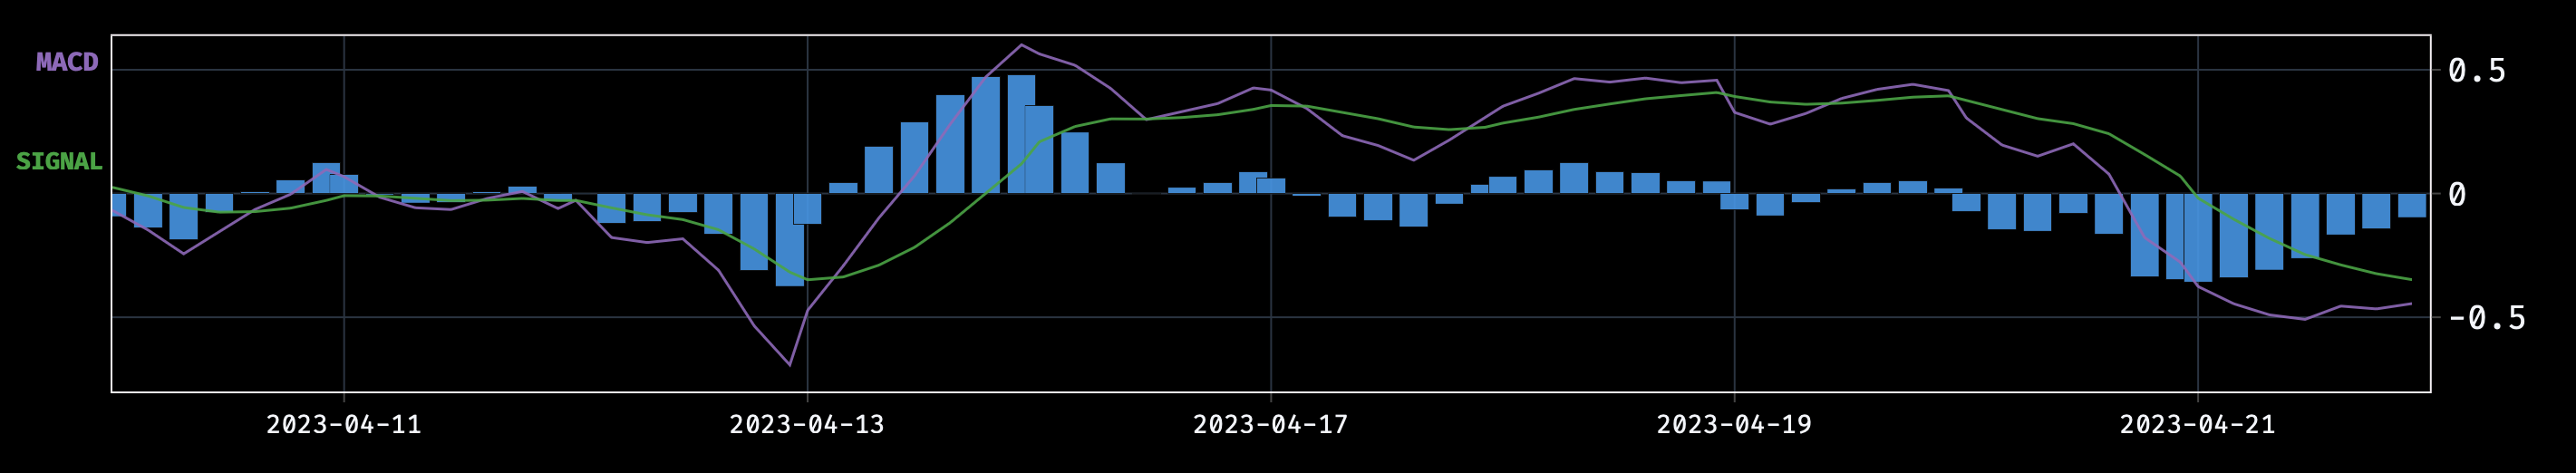
The one-hour MACD generated a downward signal trend two days ago.
load qqq -i 60 -s 2023-01-01/macd
Clicking and dragging the mouse near the corners at each axis allows the zooming to be locked to the X or Y axis only.
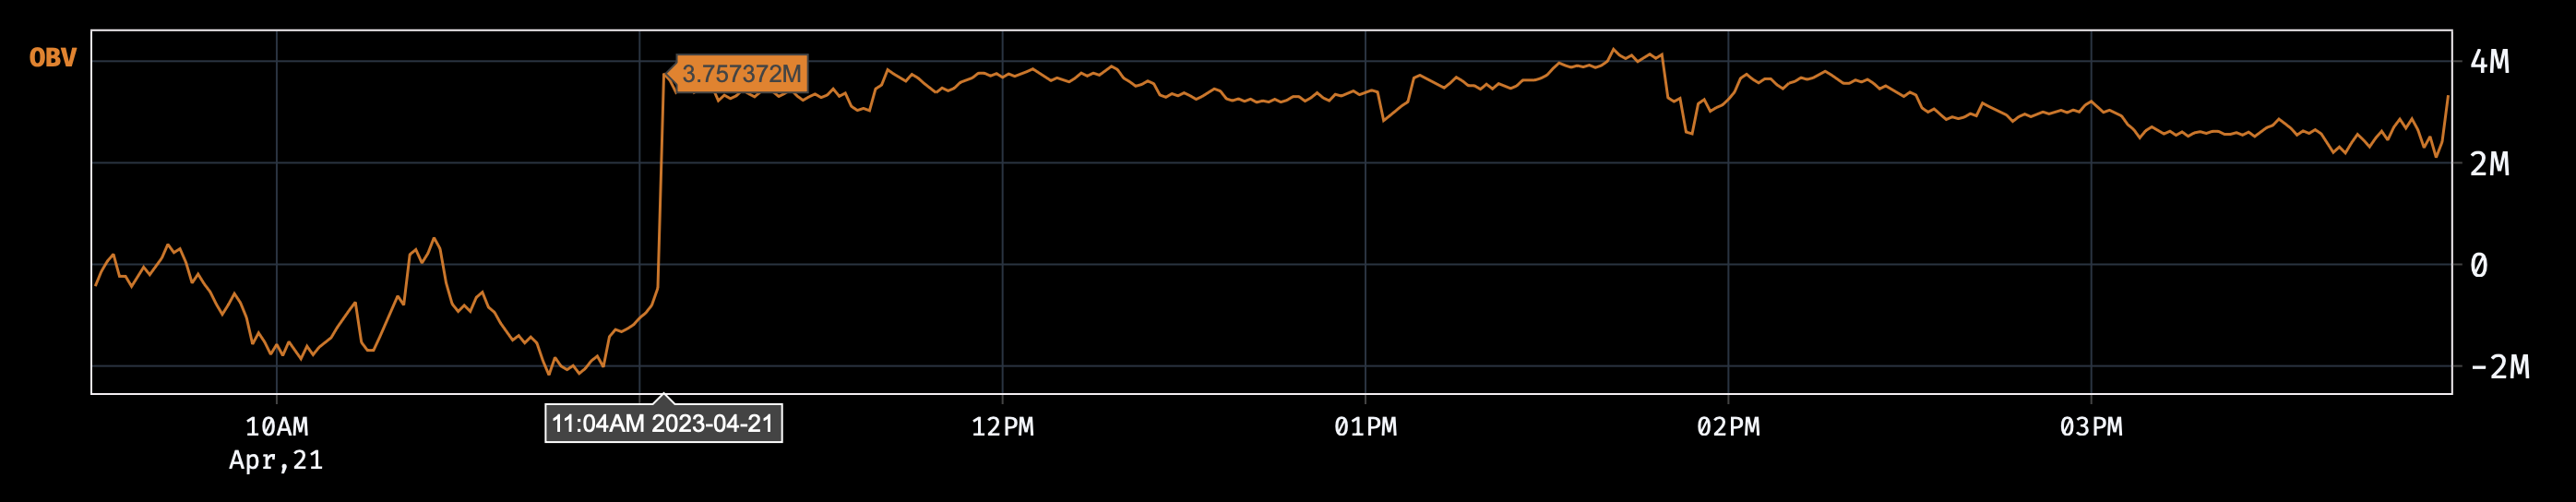
obv
Looking at the one-minute on-balance volume of QQQ today (April 21, 2023) reveals that massive volume spike occurred at 11:04. The ceiling is now the floor.
load qqq -i 1 -s 2023-04-21/macd
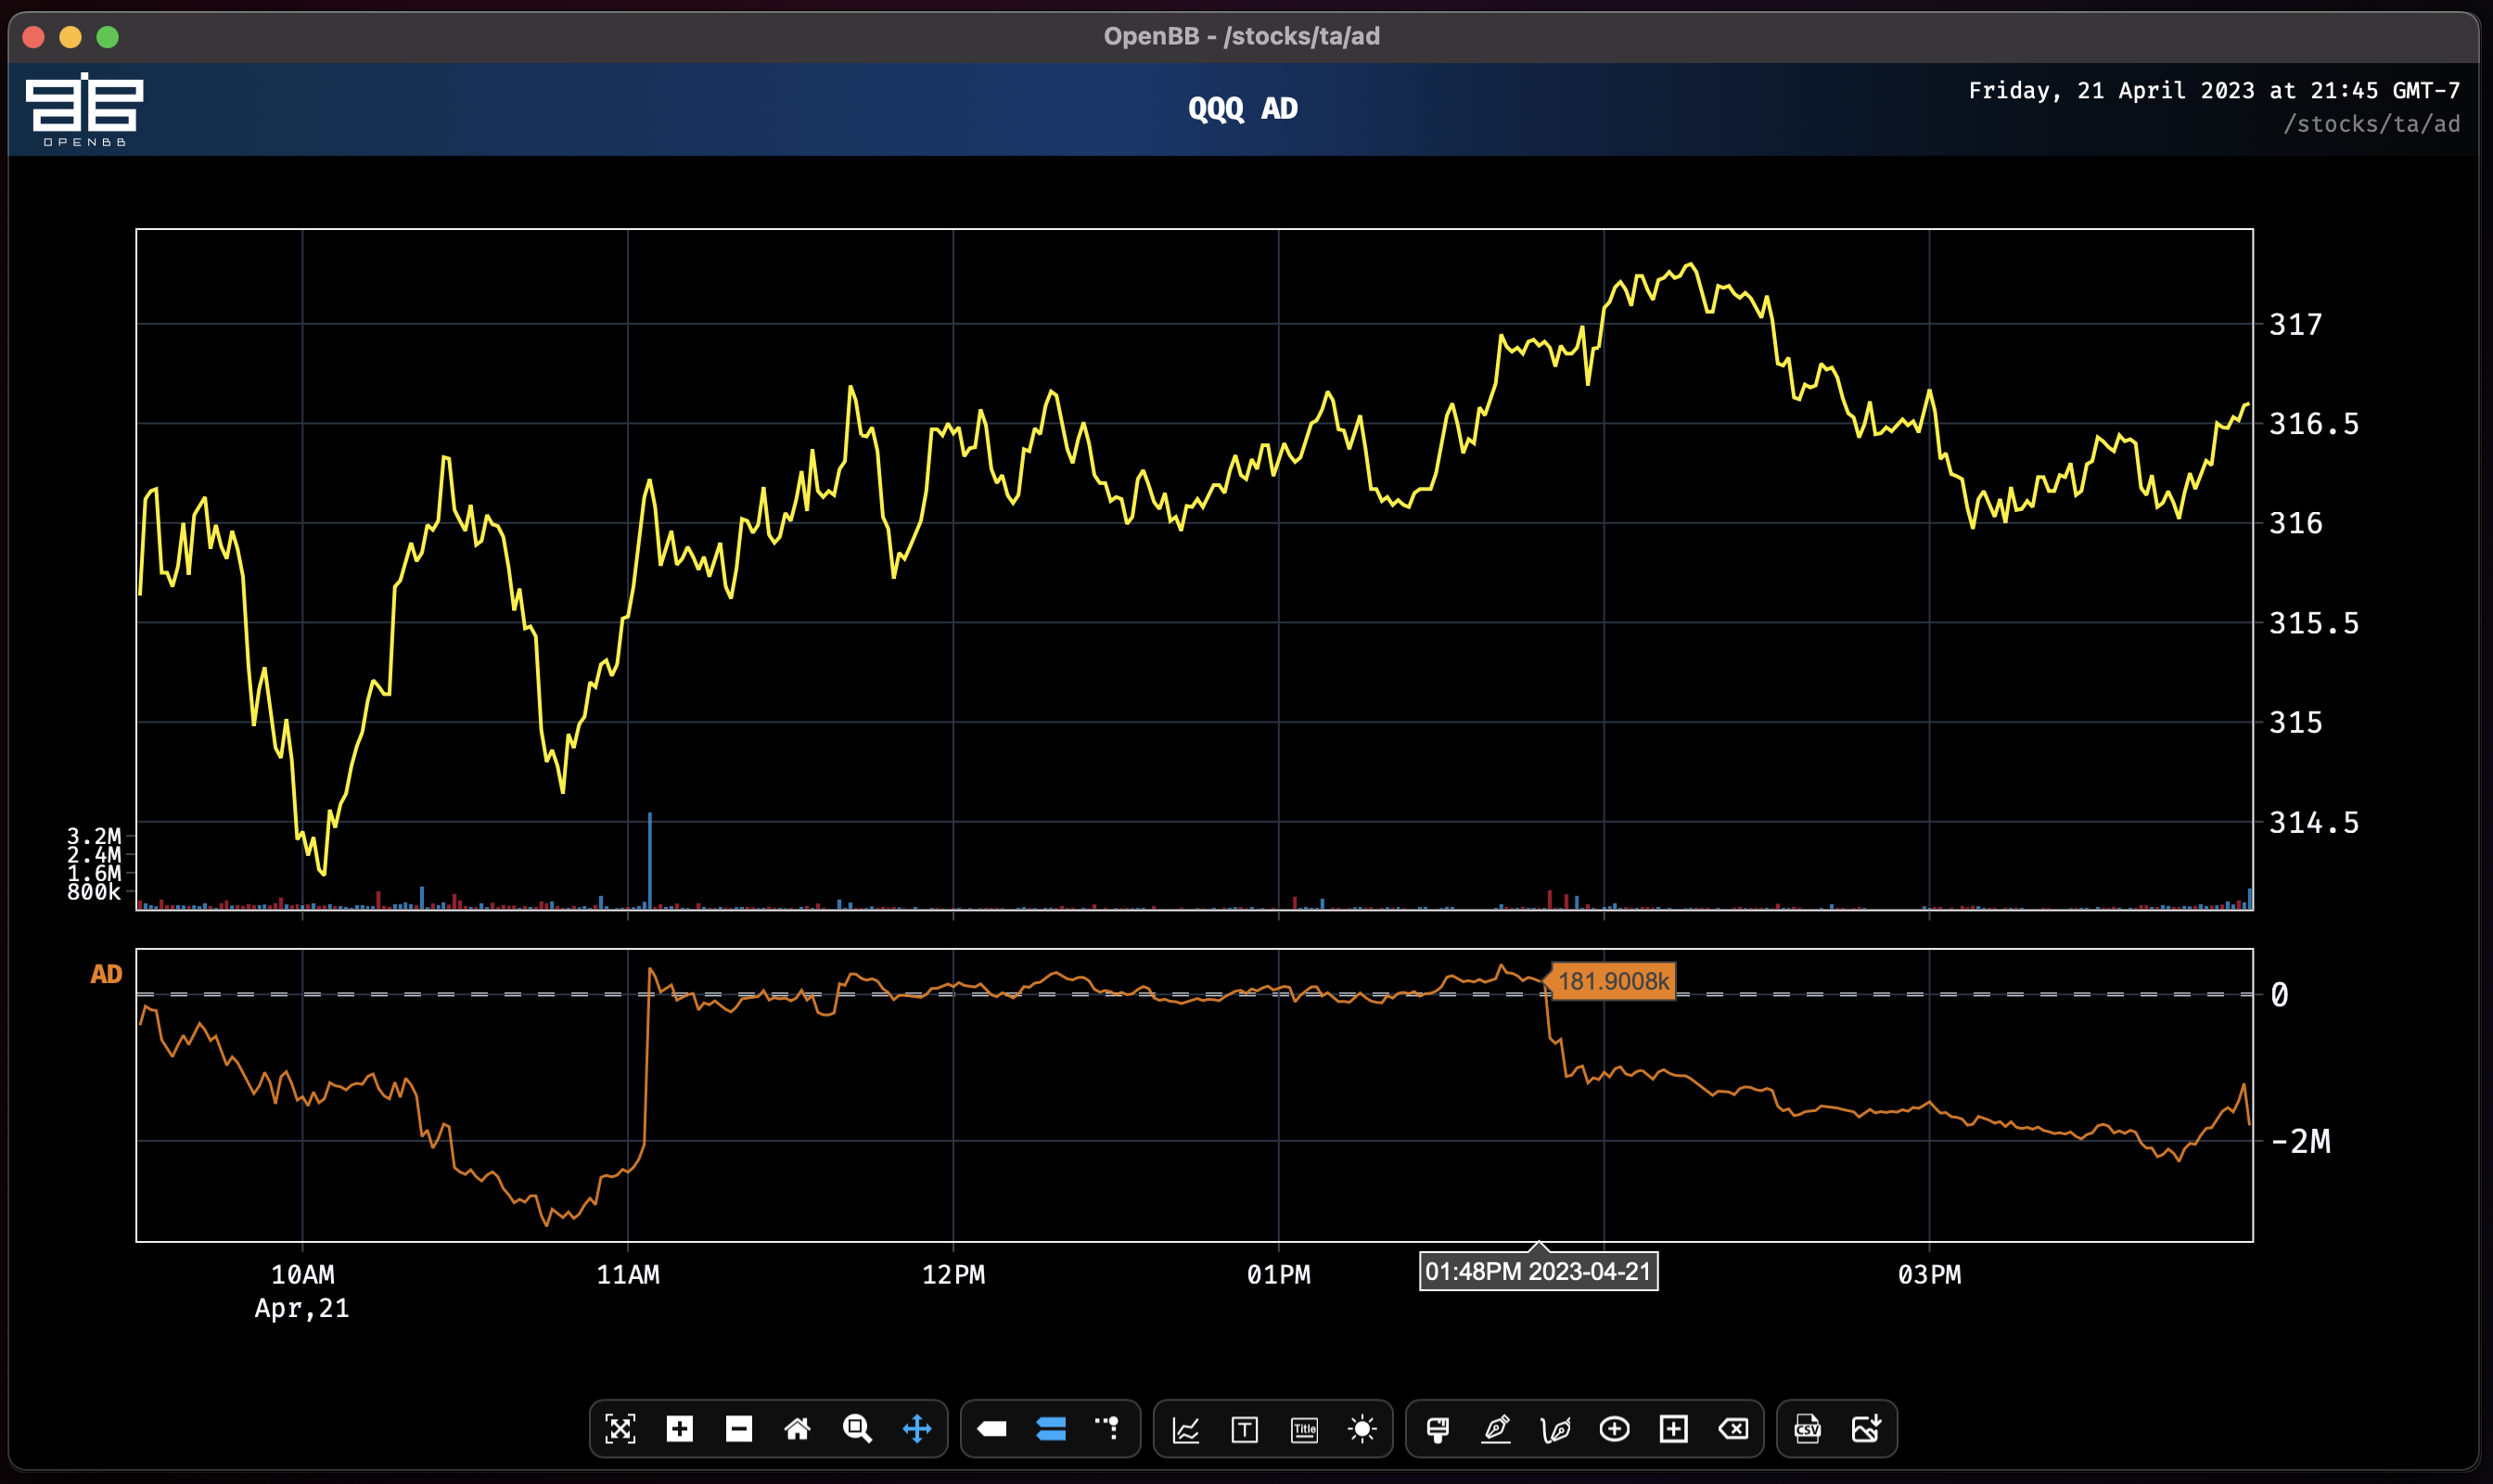
The Accumulation/Distribution Line at the same one-minute interval signals in advance of the upward drift reversal, beginning to sell into the Friday close just before 14:00.
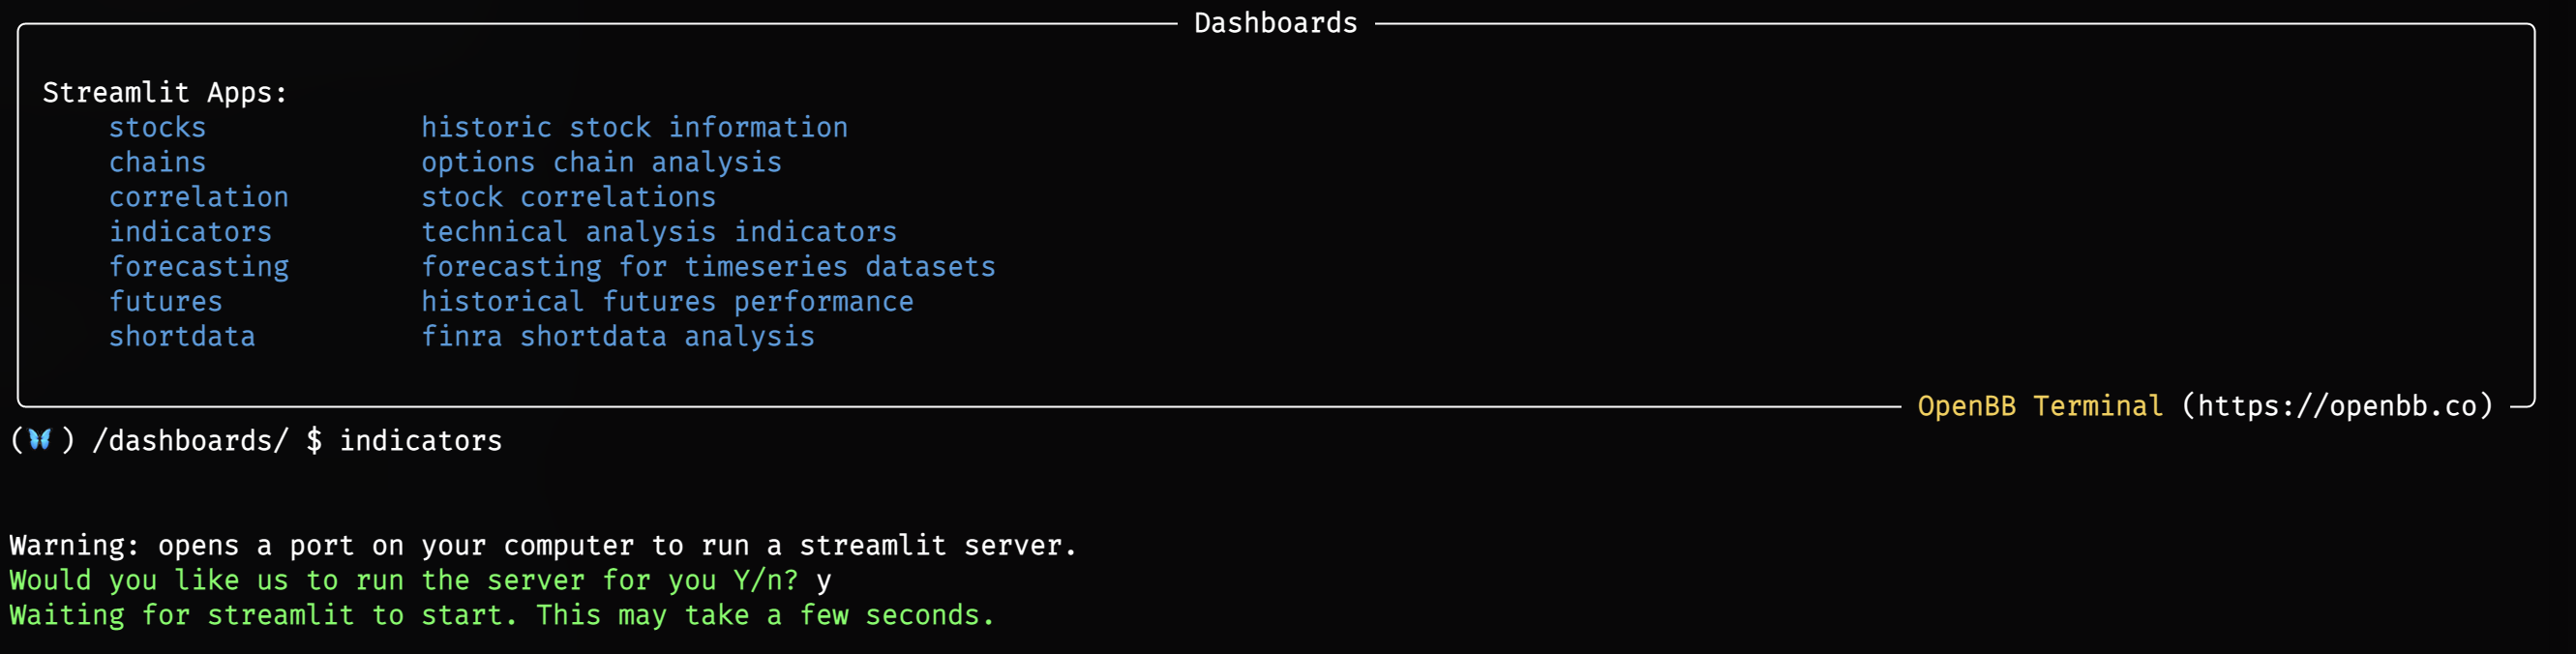
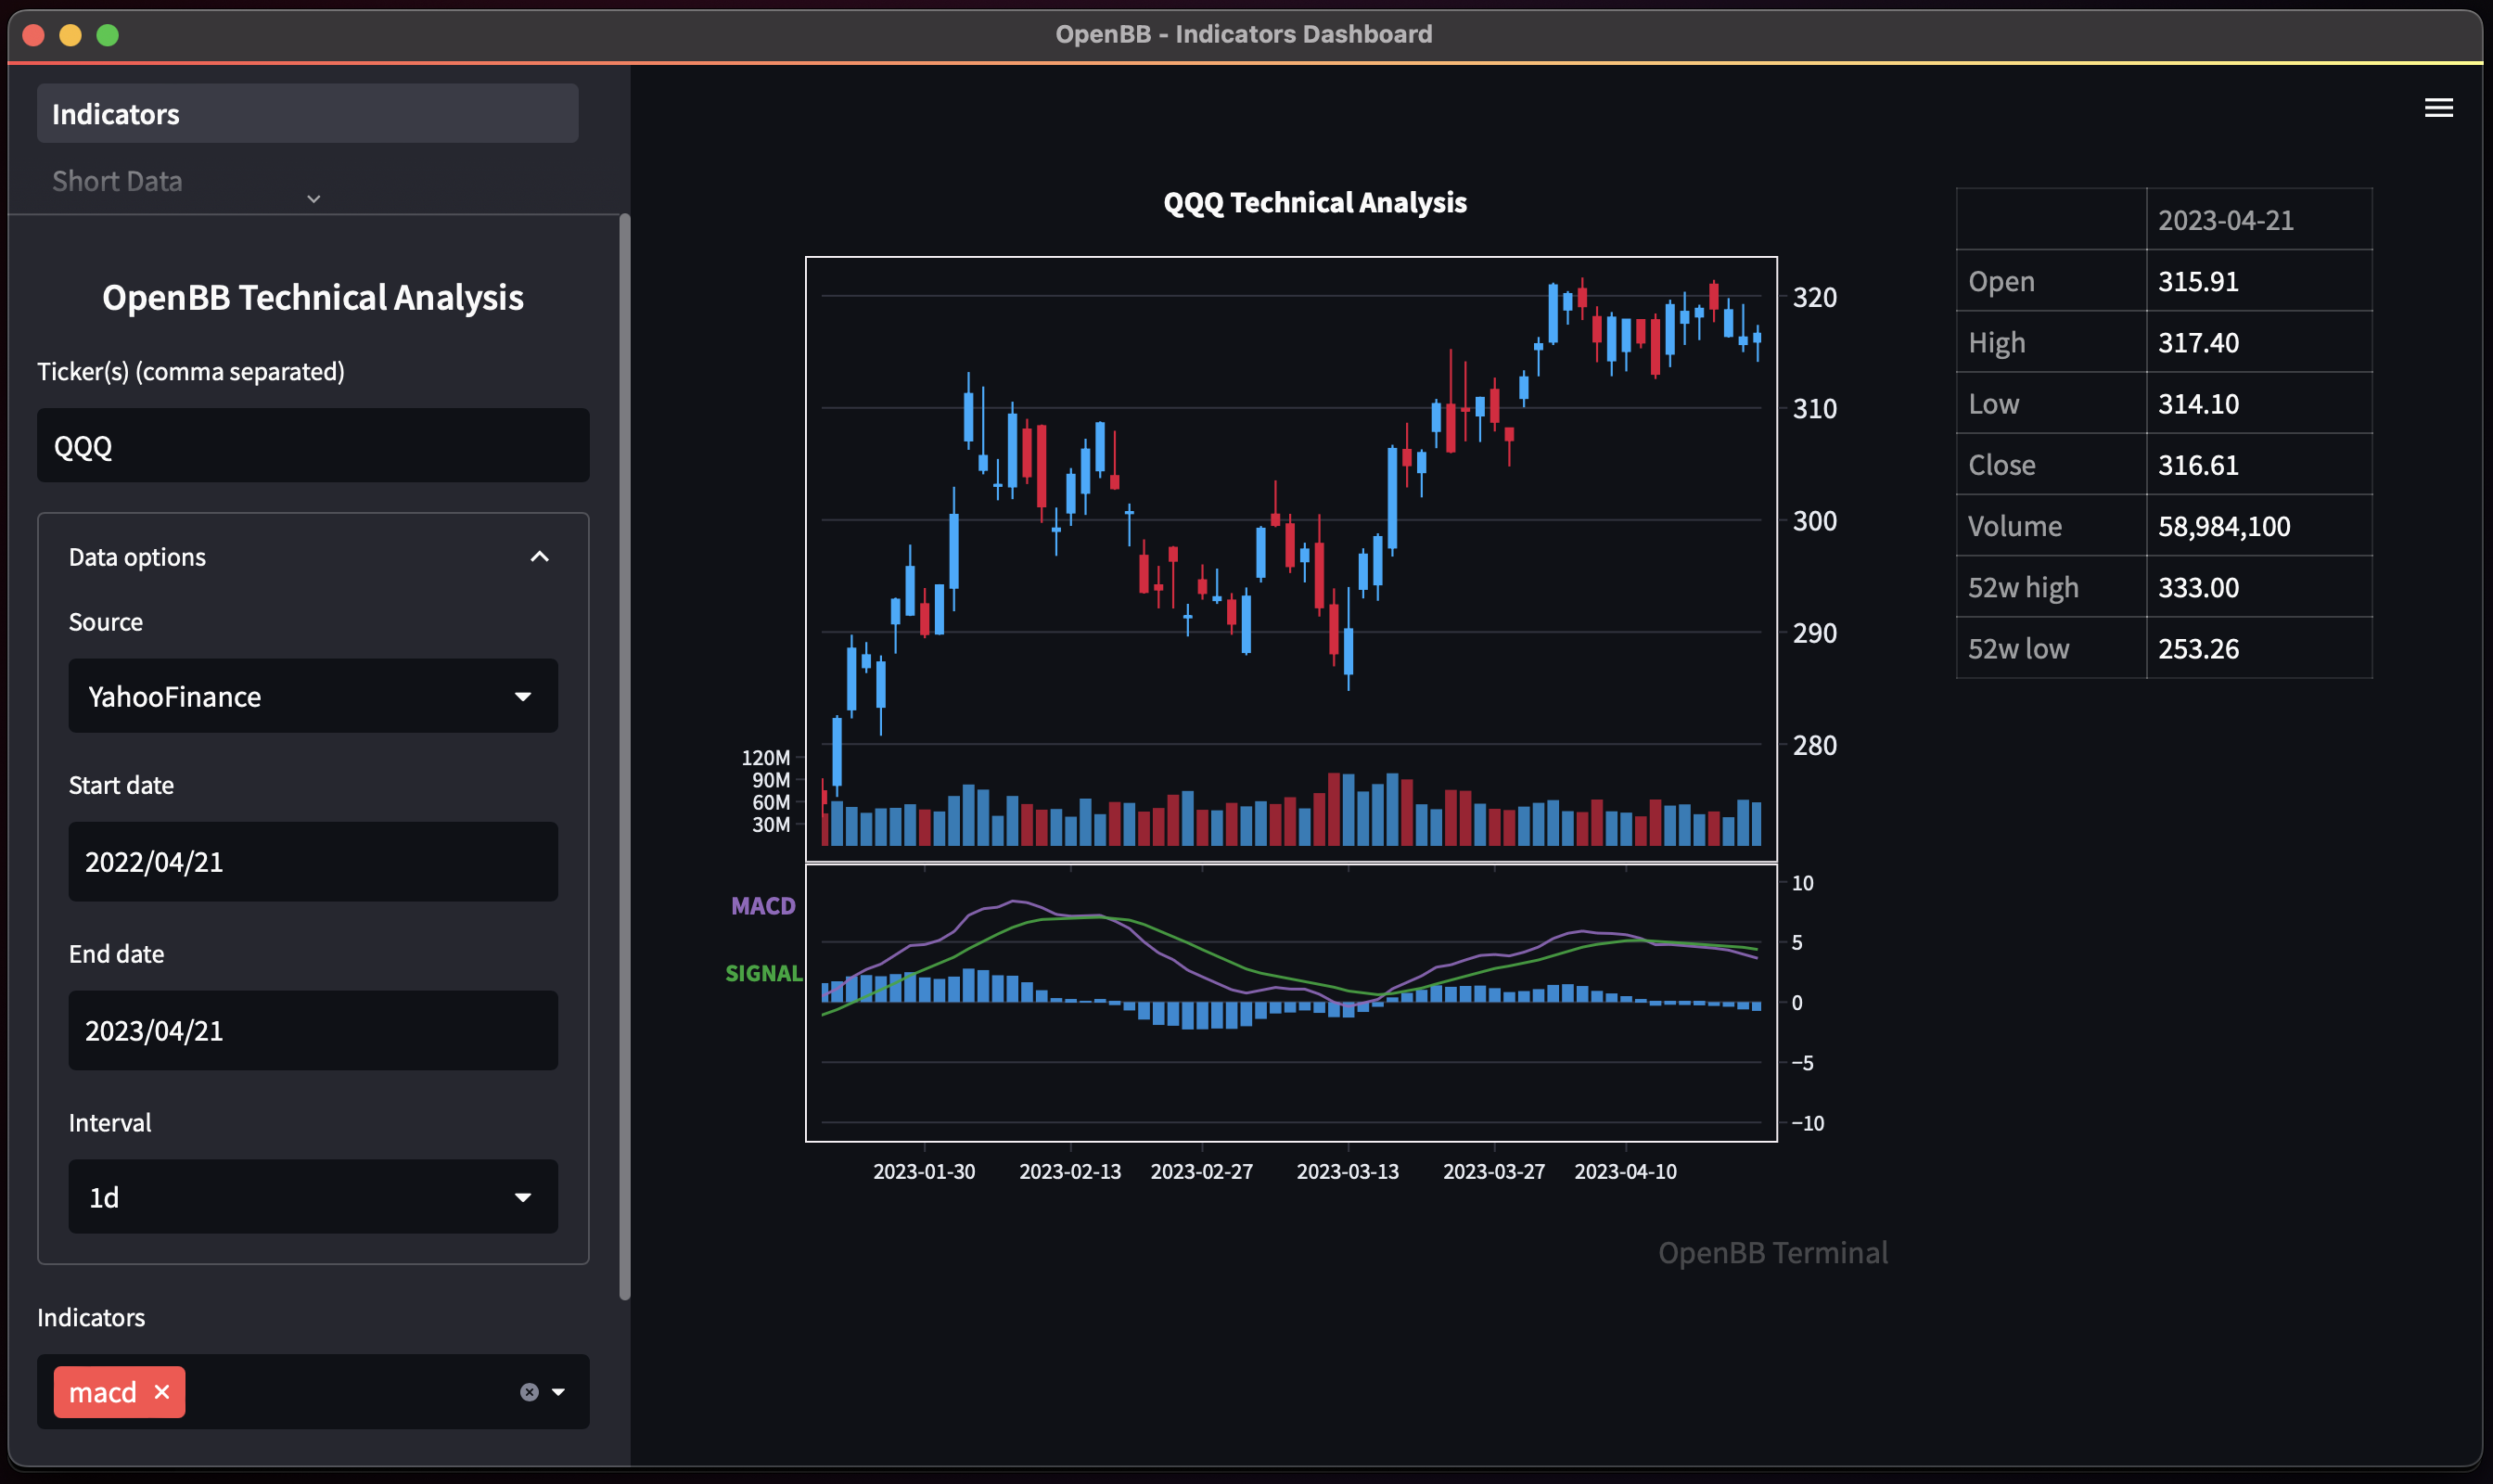
Indicators Dashboard
This menu is also available as an experimental Dashboard Streamlit App.
/dashboards/indicators