Economy
The /economy menu provides methods for querying macroeconomic data sets from sources like FRED, OECD, and EconDB. To get the most out of this menu, sign up for a free API key from the Federal Reserve of St. Louis, and enter it into the OpenBB Terminal from the /keys menu.
The Economy Menu
The menu is divided into four general sections:
- Broad market: General headline statistics from the markets today.
- Country performance: Country-specific data published by the OECD.
- Databases: Query time series.
- Stored datasets: Compare and chart multiple time series together.
Each command is listed below, with a short description.
Broad Market
| Function Key | Description |
|---|---|
| overview | Market overview of either indices, bonds or currencies. |
| futures | Futures and commodities overview. |
| map | S&P 500 heat map. |
| bigmac | The Economist's Big Mac Index. |
| events | The economic calendar. |
| edebt | External debt statitistics for various countries. |
| valuation | Valuation of sectors, industries, and countries for US-listed stocks. |
| performance | Performance of sectors, industry, and countries for US-listed stocks. |
| usdli | USD Liquidity Index |
Country Performance
| Function Key | Description |
|---|---|
| gdp | Nominal Gross Domestic Product (GDP). |
| rgdp | Real Gross Domestic Product (GDP). |
| fgdp | Forecasts of nominal and real Gross Domestic Product (GDP). |
| debt | Government debt-to-GDP ratios. |
| cpi | Harmonized CPI. |
| ccpi | CPI Components. |
| balance | Government tax revenues. |
| spending | Government spending. |
| trust | Confidence in government surveys. |
Databases
| Function Key | Description |
|---|---|
| macro | Time series data by country and indicator. |
| treasury | Historical US Treasury rates. |
| fred | Query the FRED. |
| index | Historical daily time series for most major global indices. |
Stored Datasets
| Function Key | Description |
|---|---|
| eval | A method for performing basic eval operations on a time series. |
| plot | Plot multiple time series together. |
Examples
This section will demonstrate some basic operations within the menu.
events
A morning ritual might begin with checking the economic calendar for the day's - or week's - events. The events command can browse the calendar by country and date. By default, the current day for all countries will display in a table.
/economy/events

To select a specific country, attach --countries to the command, then press the space bar. Use the up or down arrow keys to browse the choices.

overview
The overview fetches the headline levels and rates from the Wall Street Journal. Choose from of the categories by attaching the -t argument to the command.
/economy/overview -t usbonds

| Rate (%) | Yld (%) | Yld Chg (%) | |
|---|---|---|---|
| 30-Year Bond | 3.625 | 3.686 | -0.028 |
| 10-Year Note | 3.5 | 3.343 | -0.085 |
| 7-Year Note | 3.5 | 3.323 | -0.122 |
| 5-Year Note | 3.5 | 3.305 | -0.162 |
| 3-Year Note | 3.75 | 3.513 | -0.18 |
| 2-Year Note | 3.875 | 3.838 | -0.144 |
| 1-Year Bill | 0 | 4.665 | -0.09 |
| 6-Month Bill | 0 | 4.98 | 0.005 |
| 3-Month Bill | 0 | 5.212 | 0.064 |
| 1-Month Bill | 0 | 4.452 | 0.114 |
debt
Compare debt-to-GDP ratios between groups of countries by entering them as a comma-separated list.
/economy/debt -c australia,norway,united_states,italy,japan

usdli
Compare the US Dollar Liquidity Index against a selection of indices published to FRED.
/economy/usdli -o WILLSMLCAP
The indices available to overlay are displayed in a table by adding, --show, to the command.
/economy/usdli --show
valuation
Get valuations of industries and sectors for the US equity universe. Select the focus by using the, -g (--group), parameter.
valuation --group consumer_cyclical
index
Major global indices are curated under the index command. Adding --show to the command will display a table with the list.
index --show

The cumulative returns of an index is displayed instead of the levels by attaching -r to the command. Multiple indices can be queried simultaneously.
index sp500,sp400,sp600 --start 2023-01-01 -r

fred
To lookup FRED series by keywords attach, -q, to the fred command.
fred -q PCE

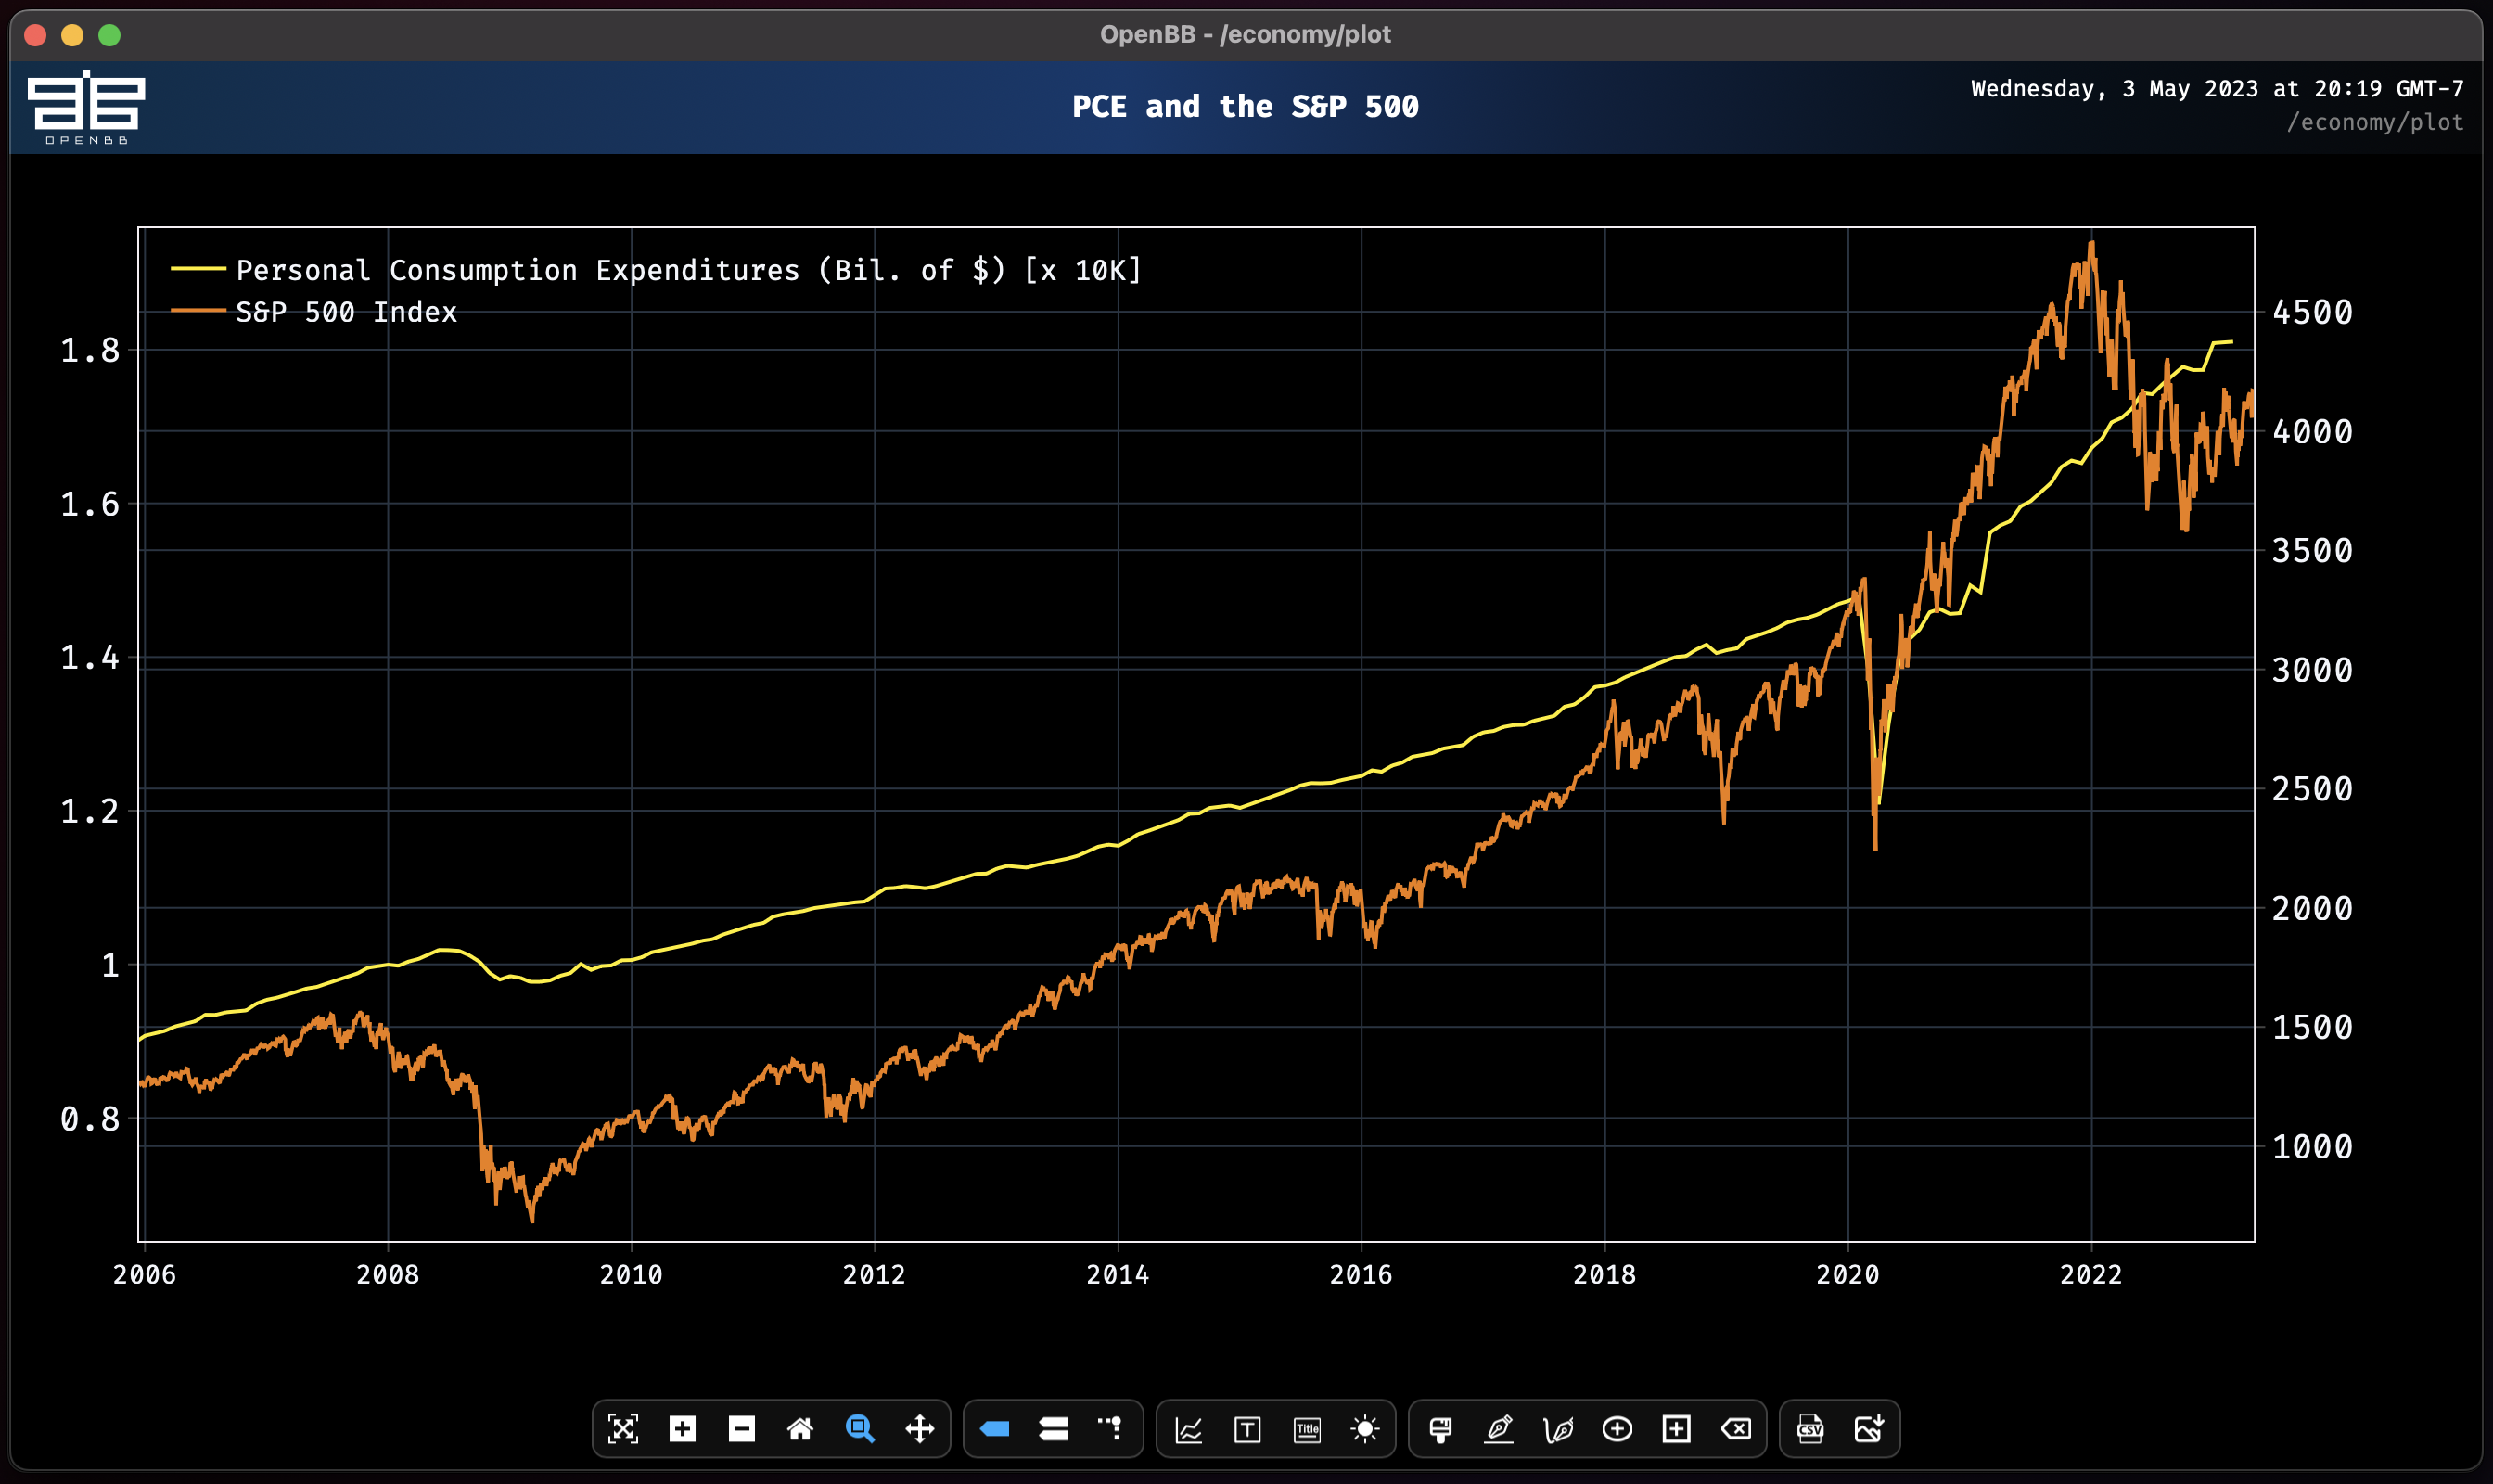
plot
After requesting a time series, it gets populated under Stored datasets. Plot them together, on a shared or separate y-axis, by using the plot command.

plot --y1 PCE --y2 sp500