Portfolio Optimization
The Portfolio Optimization menu allows the user to apply advanced optimization techniques to a portfolio of any type and of any size. It does so by introducing a multitude of optimization techniques ranging from mean-variance optimization to risk parity models and hierarchical clustering models. By providing Excel templates, the user can make sense of the vast array of parameters that each command has. E.g. think of the historic period you wish to use or which of the more than 10 risk measures and covariance methods should be used? These are questions the templates make easier to answer.
The capabilities of the Portfolio Optiminzation menu from the OpenBB Terminal are wrapped into a powerful SDK, enabling users to work with the data in a flexible environment that can be fully customized to meet the needs of any user. These functionalities allow the user to apply advanced optimization techniques to a portfolio of any type and of any size. It does so by introducing a multitude of optimization techniques ranging from mean-variance optimization to risk parity models and hierarchical clustering models. By providing Excel templates, the user can make sense of the vast array of parameters that each command has. E.g. think of the historic period you wish to use or which of the more than 10 risk measures and covariance methods should be used? These are questions the templates make easier to answer.
How to use
Start a Python script or Notebook file by importing the module:
from openbb_terminal.sdk import openbb
This menu requires the usage of the Excel templates to work properly. As there is a lot of complexity involved around these techniques, these templates allow the user to understand what values for each parameter are actually used and allow for an easy way to define the allocation.
- Download the Excel file that can be used as a template here.
- Move the file inside the
portfolio/allocationfolder within the OpenBBUserData folder and, optionally, adjust the name to your liking. - Open the Excel file and remove, edit or add to the values as you desire (e.g. your own allocation). This is the default template that is also loaded in with
load --example. - The file can now be used by following the guide.
Furthermore, given the amount of options you can choose from in each command and giving the complexity of the topic, we also provide a parameter file (both .xlsx and .ini to adjust parameters in a user-friendly way).
- Download the file that can be used as a template: xlsx (recommended) or ini (advanced).
- Move the file inside the
portfolio/optimizationfolder within the OpenBBUserData folder and, optionally, adjust the name to your liking. - Open the file and set parameters as you wish.
- Open up the OpenBB Terminal, go to
portfolio/poand typefile --file. The file should then be one of the options.
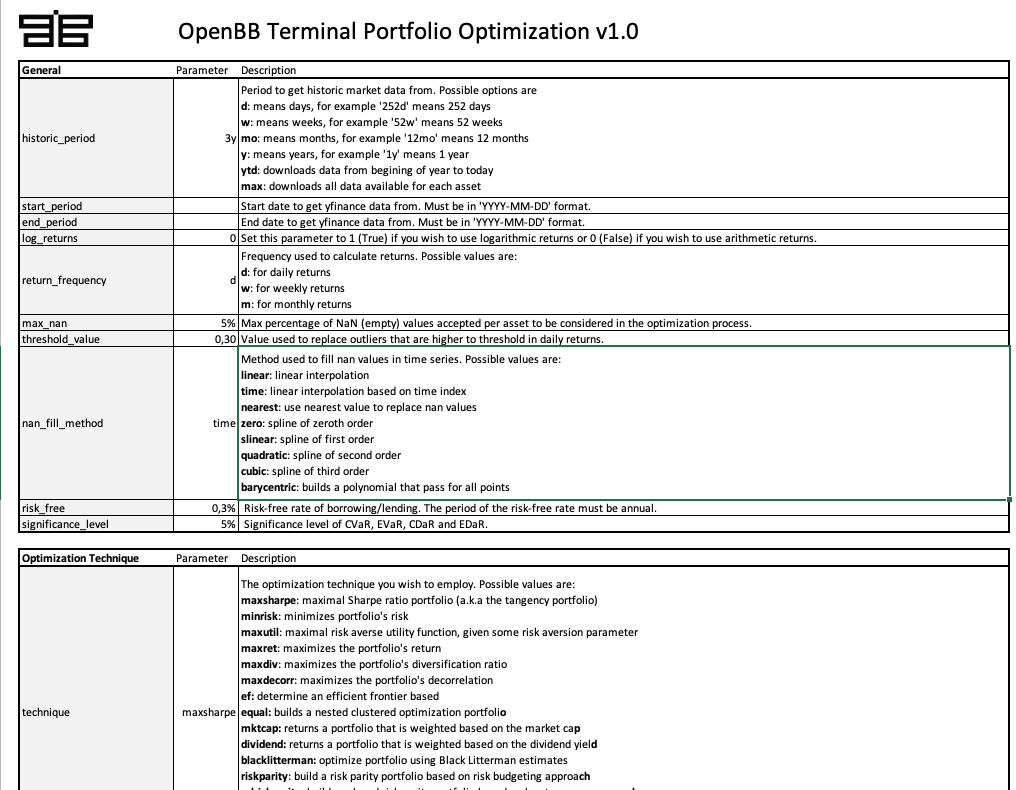
OpenBB Parameters Template
This template provides the user with the ability to set define values for each parameter based on the optimization technique that is deployed. E.g. if you select riskparity for the technique parameter, you will notice that some parameters turn grey. This means that the parameter is irrelevant for the selected method.
The OpenBB Terminal does, however, allow the user to run any model despite the technique you selected. Therefore, if you are interested in running multiple models, consider removing the value for technique. Do note that this makes it more difficult to understand which values are used for which model.
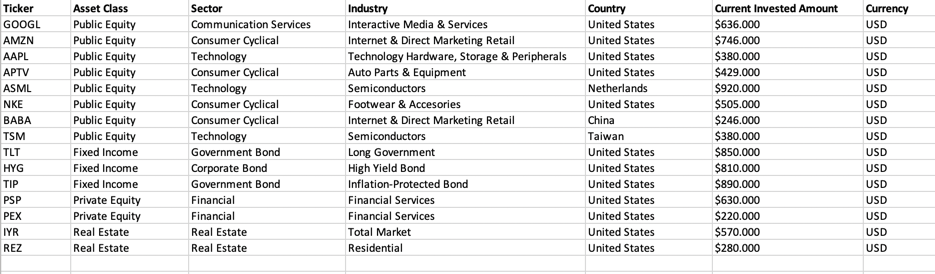
OpenBB Portfolio Template
This template hands the user a format to work with it to define the portfolio. Here, categorization is applied based on asset class, sector, industry, country and currency. By using the dropdown menus within this Excel, you are able to apply the proper categorization. This is based on the same methodology as found in other areas of the terminal.
You can load in the portfolio template with the following code:
import pandas as pd

# Define your own orderbook path here, current value won't work
order_book_path = "allocation_example.xlsx"

# Read in the file
order_book = pd.read_excel(order_book_path)

# Adjust the columns accordingly
order_book_cols = ['Ticker', 'Asset Class', 'Sector', 'Industry', 'Country',
       'Current Invested Amount', 'Currency']

order_book = order_book[order_book_cols]

# Load in the portfolio
p = openbb.portfolio.po.load(symbols_file_path=order_book_path)
weights, performance = openbb.portfolio.po.equal(portfolio_engine=p)
Performing optimization
Based on the parameters and allocation the user has set, the optimization process begins. What optimization technique is ideal depends entirely on the user's risk profile and objectives. As an illustration, Risk Parity is presented below:
# Perform calculations
weights_riskparity, data_returns_riskparity = openbb.portfolio.po.riskparity(p)

weights_riskparity
Which returns:
| Risk Parity | |
|---|---|
| AAPL | 0.0462 |
| AMZN | 0.04545 |
| APTV | 0.03177 |
| ASML | 0.03328 |
| BABA | 0.04192 |
| GOOGL | 0.04758 |
| HYG | 0.13093 |
| NKE | 0.04909 |
| TIP | 0.30826 |
| TLT | 0.21927 |
| TSM | 0.04626 |
It is possible to use the commands without loading in the parameters template or by using the parameters template but changing some arguments directly into the terminal. For example, using the same method as described above, the risk measure is changed to Conditional Value at Risk (CVaR) and the used historic period is increased to 10 years (keeping all other parameters unchanged):
# Perform calculations
weights_riskparity, data_returns_riskparity = openbb.portfolio.po.riskparity(p, interval="5y", risk_measure="CVaR")

weights_riskparity
Which returns:
| Risk Parity | |
|---|---|
| AAPL | 0.04843 |
| AMZN | 0.04302 |
| APTV | 0.03907 |
| ASML | 0.03717 |
| GOOGL | 0.04877 |
| HYG | 0.14643 |
| NKE | 0.05275 |
| TIP | 0.33264 |
| TLT | 0.20371 |
| TSM | 0.04802 |
Examples
Starting by loading in the same dataset again with the following:
import pandas as pd

# Define your own orderbook path here, current value won't work
order_book_path = "allocation_example.xlsx"

# Read in the file
order_book = pd.read_excel(order_book_path)

# Adjust the columns accordingly
order_book_cols = ['Ticker', 'Asset Class', 'Sector', 'Industry', 'Country',
       'Current Invested Amount', 'Currency']

order_book = order_book[order_book_cols]

# Load in the portfolio
P = openbb.portfolio.po.load(symbols_file_path=order_book_path)
Then, the Hierarchical Risk Parity technique is applied by using the following:
riskparity, data_returns_riskparity = openbb.portfolio.po.hrp(p, interval="5y",
    risk_measure='SLPM',
    risk_aversion=0.8)

print(riskparity)
print(data_returns_riskparity)
This results in a similar result as the following:
| Hierarchical Risk Parity | |
|---|---|
| A | 0.00199 |
| AAL | 0.00104 |
| AAP | 0.00185 |
| AAPL | 0.00184 |
| ABBV | 0.0028 |
| ... | ... |
| NOC | 0.00228 |
| XOM | 0.00167 |
| ZBRA | 0.00156 |
| ZION | 0.0014 |
| ZTS | 0.00225 |
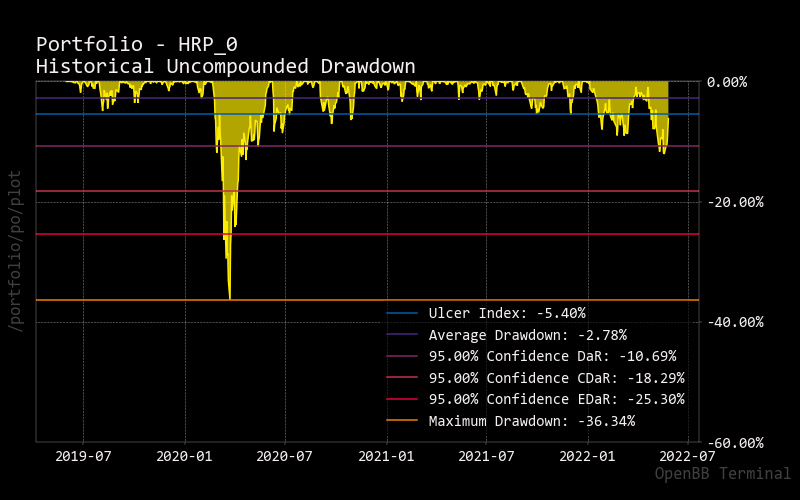
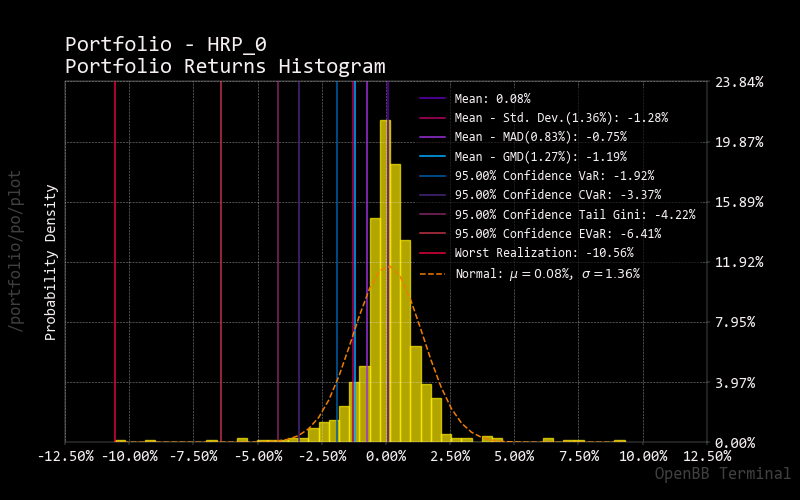
It is possible to delve further into these findings with the plot functionality for example done by looking at the portfolio's returns histogram which also includes a variety of risk measures as well as the portfolio's drawdowns.
openbb.portfolio.po.plot(p, category='SECTOR', chart_type="hist")
openbb.portfolio.po.plot(p, category='SECTOR', chart_type="dd")