Technical Analysis
The Technical Analysis module is a toolkit for analyzing time-series data, at any resolution. The functions are a collection of formulas that fit into broad categories, and they are mostly derived from the pandas_ta library:
- Momentum
- Overlap (Moving Averages)
- Trend
- Volatility
- Volume
- Other (Fibonacci)
How to Use
Every SDK function also has a secondary _chart command. The table below is a brief description of each SDK function within the ta module; for simplicity, _chart has been omitted. Technical Analysis functions specific to stocks are included as a sub-module, openbb.stocks.ta.
| Path | Category | Description |
|---|---|---|
| openbb.ta.ad | Volume | Accumulation/Distribution Line |
| openbb.ta.adosc | Volume | Chaikin Oscillator |
| openbb.ta.adx | Trend | Average Directional Movement Index |
| openbb.ta.aroon | Trend | Aroon Indicator |
| openbb.ta.atr | Volatility | Average True Range |
| openbb.ta.bbands | Voaltility | Bollinger Bands |
| openbb.ta.cci | Momentum | Commodity Channel Index |
| openbb.ta.cg | Momentum | Center of Gravity |
| openbb.ta.clenow | Momentum | Clenow Volatility Adjusted Momentum |
| openbb.ta.demark | Momentum | Tom Demark's Sequential Indicator (Unofficial) |
| openbb.ta.donchian | Volatility | Donchian Channels |
| openbb.ta.ema | Overlap | Exponential Moving Average |
| openbb.ta.fib | Other | Fibonacci Retracement |
| openbb.ta.fisher | Momentum | Fisher Transform |
| openbb.ta.hma | Overlap | Hull Moving Average |
| openbb.ta.kc | Volatility | Keltner Channels |
| openbb.ta.ma | Overlap | Moving Averages (For Charting) |
| openbb.ta.macd | Momentum | Moving Average Convergence/Divergence |
| openbb.ta.obv | Volume | On-Balance Volume |
| openbb.ta.rsi | Momentum | Relative Strength Index |
| openbb.ta.sma | Overlap | Simple Moving Average |
| openbb.ta.stoch | Momentum | Stochastic Oscillator |
| openbb.ta.vwap | Overlap | Volume-Weighted Average Price |
| openbb.ta.wma | Overlap | Weighted Moving Average |
| openbb.ta.zlma | Overlap | Zero-Lag Moving Average |
The syntax for the data argument can be:
data = ohlcv_dfWhere functions only require a single column,
data = ohlcv_df['Adj Close']data = openbb.stocks.load("ticker")Target intraday by adding the
intervalargument to theloadsyntax.
Best practice is to deploy the first method because the latter will work only with the commands requiring OHLC+V data as inputs. An error message will be returned if this is the case.
openbb.ta.obv(data = openbb.stocks.load('QQQ'))
| date | OBV |
|---|---|
| 2019-11-15 00:00:00 | 1.84279e+07 |
| 2019-11-18 00:00:00 | 3.67938e+07 |
| 2019-11-19 00:00:00 | 5.37171e+07 |
| 2019-11-20 00:00:00 | 1.70881e+07 |
| 2022-11-15 00:00:00 | -1.09017e+08 |
| 2022-11-16 00:00:00 | -1.57876e+08 |
| 2022-11-17 00:00:00 | -2.13339e+08 |
| 2022-11-18 00:00:00 | -1.59987e+08 |
The error message:
openbb.ta.rsi(data = openbb.stocks.load('QQQ'))
Please send a series and not a DataFrame.
_chart
To display the chart, instead of raw data, add _chart to the syntax before the (arguments).
openbb.ta.obv_chart(data= openbb.stocks.load('QQQ', start_date = '2022-11-18', interval = 5, prepost = True))

Examples
Import Statements
The examples here assume that this code block is at the top of the Python script of Notebook file:
import pandas as pd
from openbb_terminal.sdk import openbb
# %matplotlib inline (uncomment for Jupyter environments)
MA (Moving Averages)
The different types of moving averages, which also are individual functions (e.g., openbb.ta.ema), are available as an argument (ma_type) to the ma command. There are five accepted arguments, they are listed below in brackets:
- Simple (SMA)
- Exponential (EMA)
- Hull (HMA)
- Weighted (WMA)
- Zero-Lag (ZLMA)
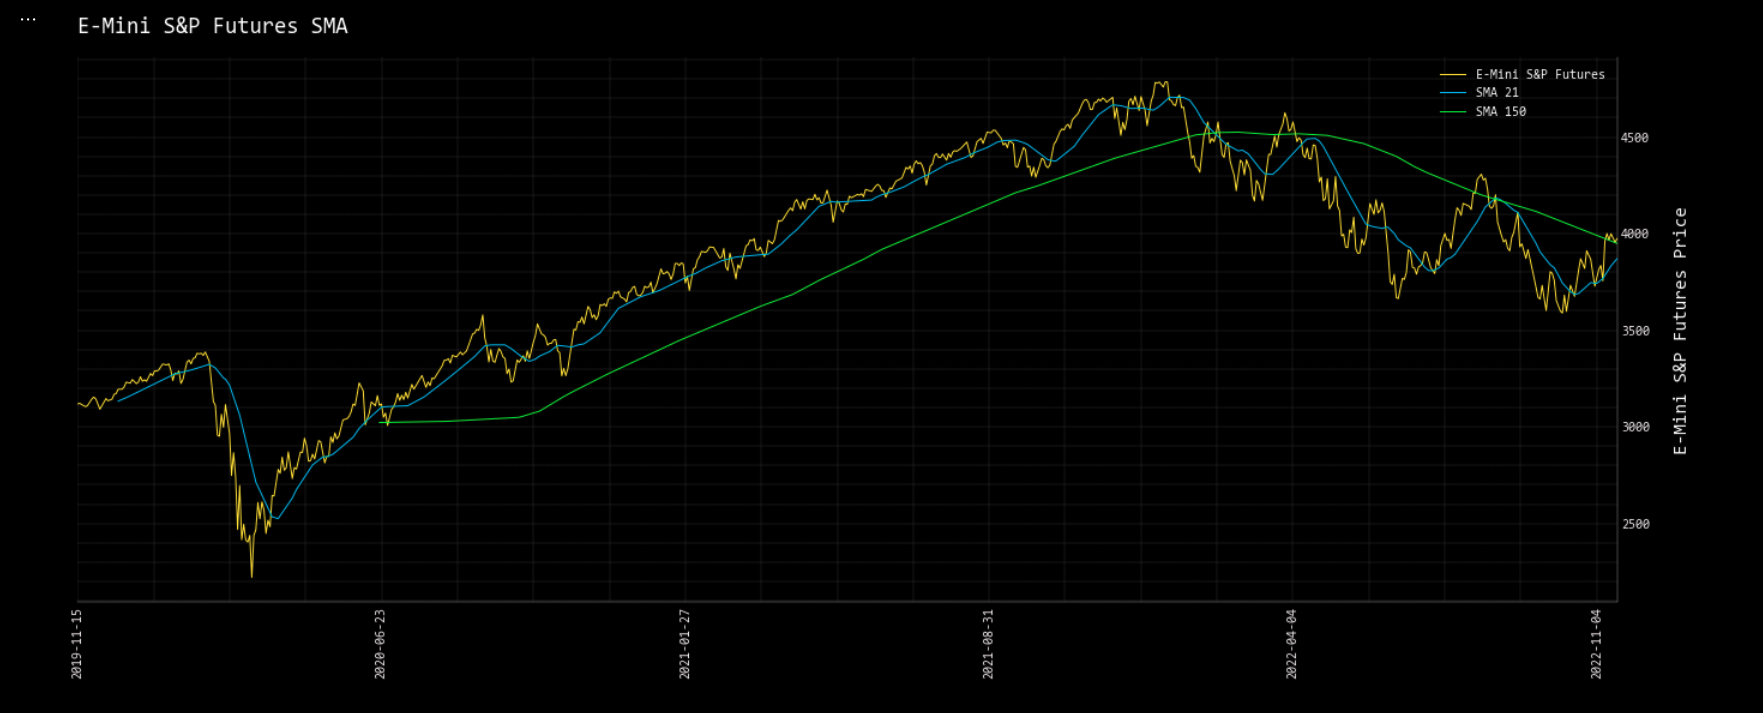
The window argument anticipates a list of integers representing the interval (minutes, days, weeks, months, etc.) to measure against the timestamp of the DataFrame's index. The example below is a daily timeseries of S&P E-Mini Futures:
es = openbb.stocks.load("ES=F")

openbb.ta.ma_chart(
    data = es['Adj Close'],
    symbol = 'E-Mini S&P Futures',
    ma_type = 'SMA',
    window = [21, 150])

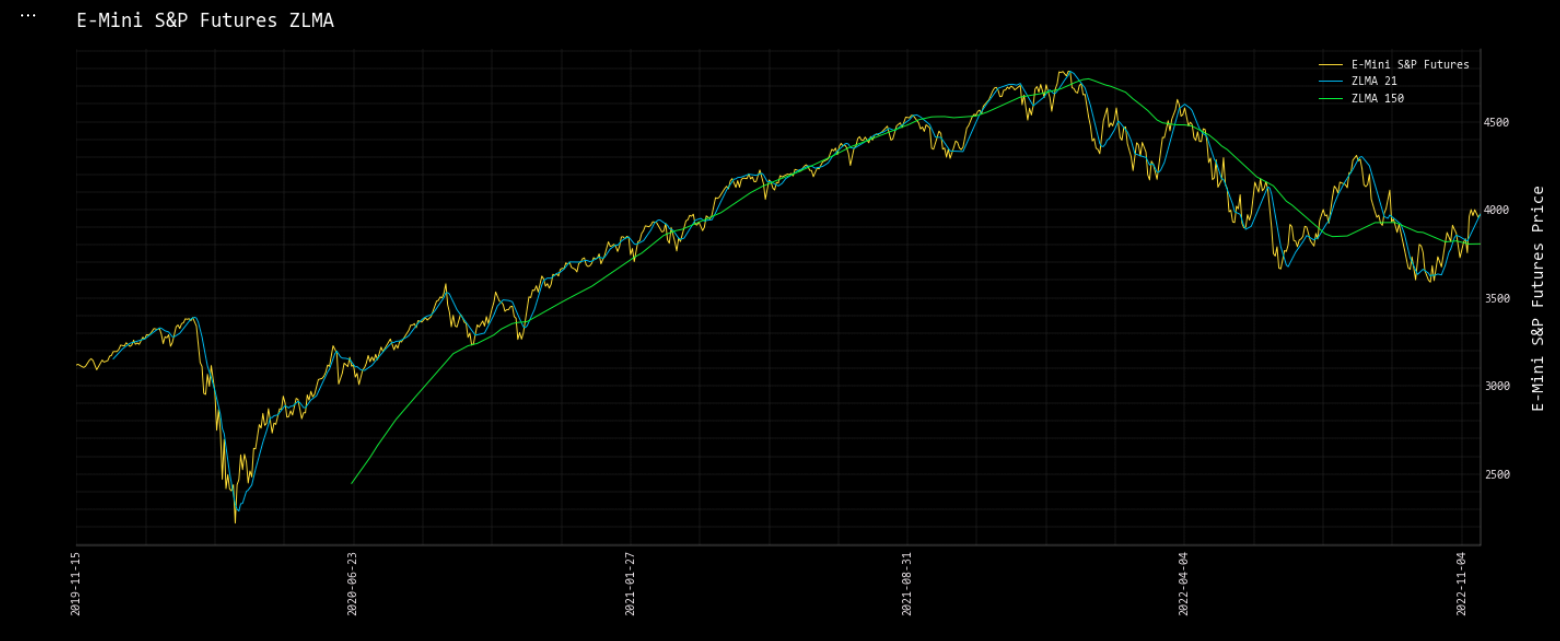
Changing, ma_type, to, ZLMA:

ATR (Average True Range)
The atr command requires OHLC data, the data argument can be the load function.
ticker = 'ES=F'
start = '2000-01-01'

df_atr = openbb.ta.atr(data = openbb.stocks.load(f"{ticker}", start_date = f"{start}", monthly = True), window = 6)

df_atr.tail(5)
| date | ATRe_6 |
|---|---|
| 2022-07-01 00:00:00 | 454.457 |
| 2022-08-01 00:00:00 | 431.612 |
| 2022-09-01 00:00:00 | 469.08 |
| 2022-10-01 00:00:00 | 455.7 |
| 2022-11-01 00:00:00 | 424.5 |
Donchian
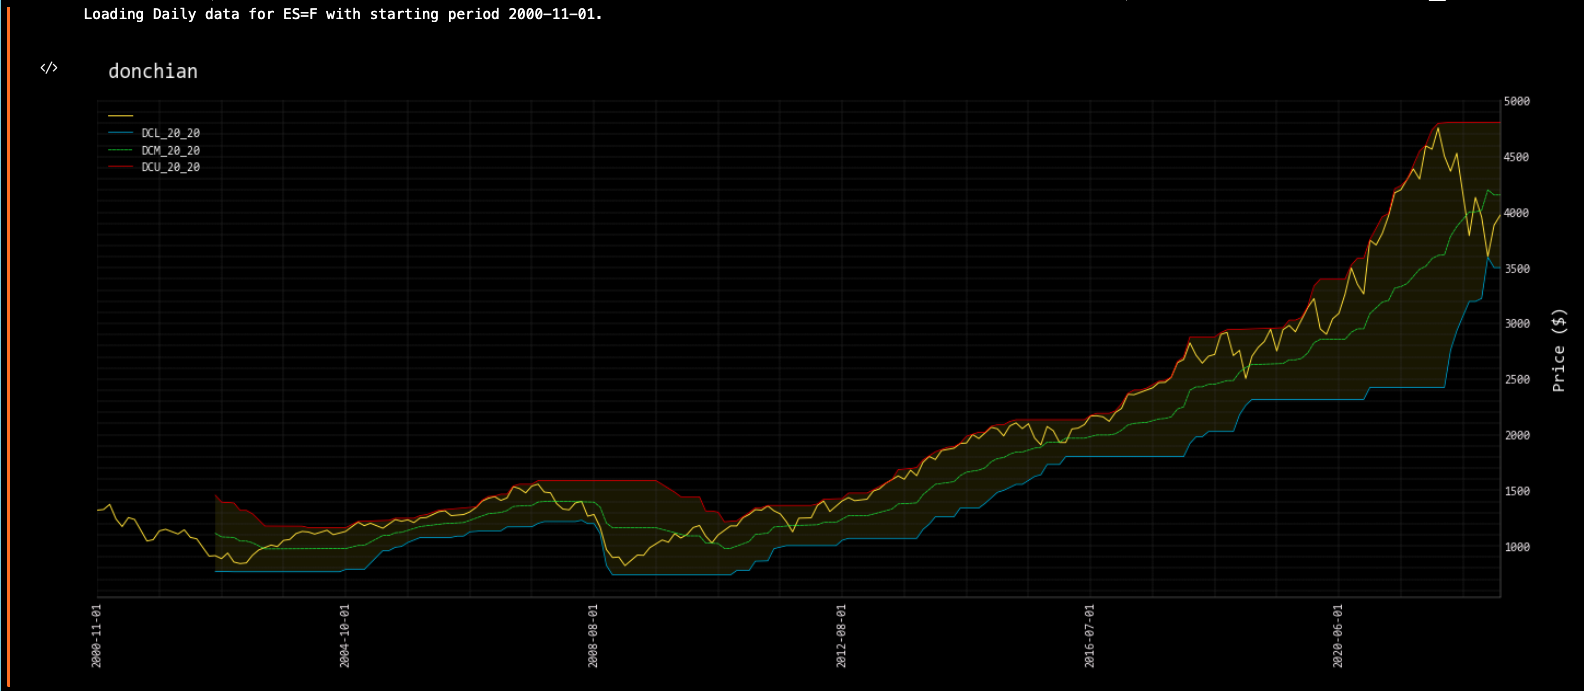
To use the same data for multiple functions, it is more efficient to first load to a Pandas DataFrame:
ticker = 'ES=F'
start = '2000-01-01'
data_df: pd.DataFrame = openbb.stocks.load(f"{ticker}", start_date = f"{start}", monthly = True)

openbb.ta.donchian_chart(data_df)

The output from a function can be joined to the OHLC data:
ticker = 'ES=F'
start = '2000-01-01'
data_df: pd.DataFrame = openbb.stocks.load(f"{ticker}", start_date = f"{start}", monthly = True)

donchian = openbb.ta.donchian(data_df)

data_df = data_df.join(donchian)

data_df.tail(5)
| date | Open | High | Low | Close | Adj Close | Volume | DCL_20_20 | DCM_20_20 | DCU_20_20 |
|---|---|---|---|---|---|---|---|---|---|
| 2022-07-01 00:00:00 | 3782 | 4144 | 3723.75 | 4133.5 | 4133.5 | 3.40941e+07 | 3198 | 4003.12 | 4808.25 |
| 2022-08-01 00:00:00 | 4137.5 | 4327.5 | 3953 | 3956.5 | 3956.5 | 3.84732e+07 | 3225 | 4016.62 | 4808.25 |
| 2022-09-01 00:00:00 | 3958 | 4158 | 3595.25 | 3601.5 | 3601.5 | 4.68698e+07 | 3595.25 | 4201.75 | 4808.25 |
| 2022-10-01 00:00:00 | 3593.25 | 3924.25 | 3502 | 3883 | 3883 | 4.80686e+07 | 3502 | 4155.12 | 4808.25 |
| 2022-11-01 00:00:00 | 3884 | 4050.75 | 3704.25 | 3974 | 3974 | 2.65215e+07 | 3502 | 4155.12 | 4808.25 |