Basics
Overview
The OpenBB SDK provides programmatic access to nearly all Terminal commands, allowing custom scripts and functions to power creations built on top of the core platform. It is easy to use and as flexible as one's imagination. The sections below will outline how to get started using it. If it isn't already installed, follow the instructions to install via PyPi (pip) or from the source code.
Importing the OpenBB SDK
No additional software is required to use the OpenBB SDK, it can be consumed directly from the command line Terminal within the virtual environment created during the installation process.
Terminal Command Line
The obb virtual environment has both python and ipython as methods for starting a new session from scratch.
- Step 1: Activate the
obbvirtual environment.conda activate obb
If this doesn't work, there may be an obvious reason why.
- The installation was not completed.
- The terminal being used is different from the one which was used for installation. For example, Miniconda was installed using
CMD.exeorAnaconda Prompt, but the current terminal is PowerShell.
Open the same terminal used for installation and activate the obb environment, then enter:
conda init --all --system
Exit and re-open. Conda should now be callable from all terminal shell profiles.
- Step 2: Start a new Python or iPython session.
pythonipython
This will display a similar message to the one below.
(obb) Steves-MacBook-Pro:OpenBBTerminal steve$ python
Python 3.10.8 | packaged by conda-forge | (main, Nov 22 2022, 08:25:13) [Clang 14.0.6 ] on darwin
Type "help", "copyright", "credits" or "license" for more information.
>>> from openbb_terminal.sdk import openbb
ipython will look slightly different.
(obb) Steves-MacBook-Pro:OpenBBTerminal steve$ ipython
Python 3.10.8 | packaged by conda-forge | (main, Nov 22 2022, 08:25:13) [Clang 14.0.6 ]
Type 'copyright', 'credits' or 'license' for more information
IPython 8.11.0 -- An enhanced Interactive Python. Type '?' for help.

In [1]: from openbb_terminal.sdk import openbb
ipython is a good choice for exploring and working on scripts without saving them as a new file, while the plain command line version, python, is what a scripted .py file would use to run.
Jupyter
Jupyter is a code editor and IDE that runs in a web browser, served over localhost. No additional installation steps are required to use it, in two flavours, notebook and lab. Both are launched from the terminal command line, after activating the obb virtual Python environment.
conda activate obb
jupyter lab
Or
conda activate obb
jupyter notebook
This will launch the Jupyter server and open a browser window with the application.
There will be only one choice for the kernel, Python3 (ipykernel). Click on, Select.
In the console window (or a new Notebook file) the OpenBB SDK is imported by entering:
from openbb_terminal.sdk import openbb
Docstrings can be viewed in a pop-up with the key command, shift+tab. The contents of each module (similar to the menus in the OpenBB Terminal) can be browsed by hitting the tab key.
The Contextual Help window displays more details, and also previews DataFrames after they are assigned. These tools are an excellent way to understand the structure of the SDK along with the syntax for each command and argument.
Code Editors and IDEs
Regardless of the code editor of choice, the program must know that the obb virtual Python environment exists. The steps for setting it up will vary by platform, consult the manual for the specific editor. VS Code is a recommended choice because it is free, flexible, and has integrations with GitHub and Jupyter, and has a plugin marketplace that can enhance a workspace with tools like GitHub Co-Pilot. Some code editing and IDE suites will charge a subscription for Jupyter integrations, which make them less ideal.
Spyder is not recommended for installing or operating the OpenBB SDK.
Helpful VS Code Extensions
Installing a few extensions in VS Code will improve the user experience and provide enhanced functionality.
- Python Extension Pack (Don Jayamanne)
- Jupyter PowerToys (Microsoft)
- Jupyter Notebook Renderers
- Codeium
Icons on the sidebar for Jupyter and Python provide quick access to the virtual environments, and a new notebook or interactive window are created with a mouse click.
When opening a Notebook file, or a new interactive window, ensure that the correct environment is being used. If the selected environment is not the one created during installation, the OpenBB SDK will not import.
Click on the item in the top-right of the window to select or change the environment.
The OpenBB SDK is imported with:
from openbb_terminal.sdk import openbb
Navigation
The layout of the OpenBB SDK is similar to the menus in the OpenBB Terminal, with each one represented as a module. Instead of a / in the path, it is .. For example, openbb.stocks.gov is the Government submodule of stocks.
The attributes for each module - and docstrings for a function - can also be printed directly to the screen, insert a question mark at the end of the string.
openbb.stocks.gov.contracts?
Note: For a regular python session, the syntax is: help(openbb.stocks.gov.contracts)
Signature:      openbb.stocks.gov.contracts(symbol: str, past_transaction_days: int = 10) -> pandas.core.frame.DataFrame
Call signature: openbb.stocks.gov.contracts(*args: Any, **kwargs: Any) -> Any
Type:           get_contracts
String form:    <openbb_terminal.stocks.government.quiverquant_model.Operation object at 0x2b57d0700>
File:           ~/GitHub/OpenBBTerminal/openbb_terminal/stocks/government/quiverquant_model.py
Docstring:
Get government contracts for ticker [Source: quiverquant.com]

Parameters
----------
symbol: str
    Ticker to get congress trading data from
past_transaction_days: int
    Number of days to get transactions for

Returns
-------
pd.DataFrame
    Most recent transactions by members of U.S. Congress
Docstrings
Docstrings are the SDK equivalent to the Terminal's --help argument. They contain information on the functions, its input parameters, and the type of data being returned. The Contextual Help window, in Jupyter, is a very convenient way to keep this information on hand. Referencing the docstrings will greatly reduce the need to consult the online documentation pages.
API Keys
The keys module provides methods for managing access credentials to data sources. If the API keys have already been set in a locally installed OpenBB Terminal application, no further action is required. A new installation can be authorized using the OpenBB Hub, or they can be entered manually in the SDK. For instructions on obtaining and authorizing each individual source, see the guide here. A key can be stored permanently, or only for the active session. Use the persist boolean argument to remember or forget it.
openbb.keys.fred(key= "REPLACE_WITH_YOUR_KEY", persist=True)
Authorize With the OpenBB Hub
API keys can be imported to the session by logging in to an OpenBB Hub account. The session can persist, if desired, otherwise they will be valid only for the current session. We recommend connecting to Hub by generating a Personal Access Token. Follow the link, scroll to the bottom of the page, and click the "Generate" button.
Copy the generated token and enter as the value for the token parameter, ignoring the email and password fields. By default, the credentials will be forgotten when the SDK session is terminated.
openbb.login?
Signature:
openbb.login(
    email: str = '',
    password: str = '',
    token: str = '',
    keep_session: bool = False,
    silent: bool = False,
)
Docstring:
Login and load user info.
If there is a saved session it will be used (this can be achieved by `keep_session=True`).
If there's not a local session,
the user can use either email and password or the OpenBB Personal Access Token.

Parameters
----------
email : str
    The email.
password : str
    The password.
token : str
    The OpenBB Personal Access Token.
keep_session : bool
    Keep the session, i.e., next time the user logs in,
    there is no need to enter the email and password or the token.
silent : bool
    If True, the console print will be silent.

Examples
--------
>>> from openbb_terminal.sdk import openbb
>>> openbb.login(email="<your email>", password="<your password>")
File:      ~/GitHub/OpenBBTerminal/openbb_terminal/core/session/sdk_session.py
Type:      function
Login with an access token with the syntax:
openbb.login(token = "REPLACE_WITH_THE_PERSONAL_ACCESS_TOKEN")
The token can be revoked from the OpenBB Hub API Keys page, by clicking on the Regenerate button, which will invalidate the current one.
How to Use the SDK
The syntax examples provided assume that the SDK has already been imported.
from openbb_terminal.sdk import openbb
Function Inputs
The majority of parameters accept a string as the input. The docstrings will describe the expected inputs, but most will follow these general guidelines, unless otherwise stated:
- String values are surrounded by quotation marks, or a single apostrophe.
"the string", or'the string to enter'
- Some commands expect a list for the main input, and are contained within square brackets, with each item separated by a comma.
["the first string", "the second string"]openbb.stocks.quote(["SPY", "QQQ", "IWM", "AAPL", "MSFT", "TSLA", "GOOG", "META", "AMZN"])
- Dates are entered as a string, and follow the format: "YYYY-MM-DD".
openbb.stocks.load("SPY", start_date="1994-01-01")
- When the expected input of a parameter is an integer or float value, they are entered without quotes.
limit = 10
- Boolean arguments are always capitalized.
- True
- False
Function Responses
Most data objects returned by functions are Pandas DataFrames, and the results will be printed without first assigning it to a variable.
openbb.stocks.quote("SPY")
The presentation of the responses will vary by platform, the sample above is from Jupyter Lab. When the same function in the Terminal outputs a chart, the response is separated into the model and view components. The SDK map will show two functions for the same command where the second has _chart added on. Using this second command will display the chart while the former returns the raw Pandas DataFrame.
data = openbb.stocks.load("SPY", weekly = True)
openbb.ta.atr_chart(data, symbol = "SPY")
If the SDK session is from the command line (python or ipython), a window will open to display the chart. Within an IDE, or Jupyter Notebook, they will be displayed inline and will not have the same toolbars.
Passing Data Through
Using the output of one function to feed another input will be a common workflow. Basic operations do not require importing any Python packages. The example below adds a new column, with the 20-day simple moving average, to the existing DataFrame.
data = openbb.stocks.load('VOO', start_date = "2022-05-15")
data["SMA"] = openbb.ta.sma(data = data["Close"], length = 20)
The code block below takes the top ten results from the unusual_volume screener preset, gets a single DataFrame with the daily returns for each ticker YTD, then identifies the date of the best performing day. These operations will require importing the Pandas library to the session.
import pandas as pd

results = openbb.stocks.screener.screener_data('unusual_volume')
tickers = results.sort_values(by = "Volume", ascending = False).head(10)["Ticker"].to_list()
openbb.stocks.quote(tickers)
ytd_returns = openbb.stocks.ca.hist(tickers, start_date = '2023-01-01', candle_type = 'r')
date = ytd_returns.idxmax()
returns = ytd_returns.max()
max_returns = pd.concat([date,returns], axis = 1)
max_returns.columns = ["Date", "Returns"]

max_returns
| Date | Returns | |
|---|---|---|
| GSIT | 2023-05-12 00:00:00 | 2.10366 |
| WISA | 2023-03-27 00:00:00 | 0.894737 |
| LMFA | 2023-05-15 00:00:00 | 0.399731 |
| OKE | 2023-05-05 00:00:00 | 0.0300176 |
| GETR | 2023-05-12 00:00:00 | 0.450151 |
| MMP | 2023-05-15 00:00:00 | 0.12994 |
| ORMP | 2023-05-15 00:00:00 | 0.106007 |
| MGOL | 2023-03-28 00:00:00 | 0.322957 |
| TIVC | 2023-01-12 00:00:00 | 0.19 |
| REAL | 2023-05-08 00:00:00 | 0.191304 |
OpenBB Figure Objects
Functions returning a chart will have a boolean argument labeled, external_axes. When this is set as True, and the function's output is assigned to a variable, a Plotly figure object is returned, which can be manipulated accordingly. Copy the block below to see all the parameters that can be set.
data = openbb.stocks.candle("SPY", external_axes = True)
data?
Charts called from a command line session, will open a new window and appear the same as they are in the OpenBB Terminal application.
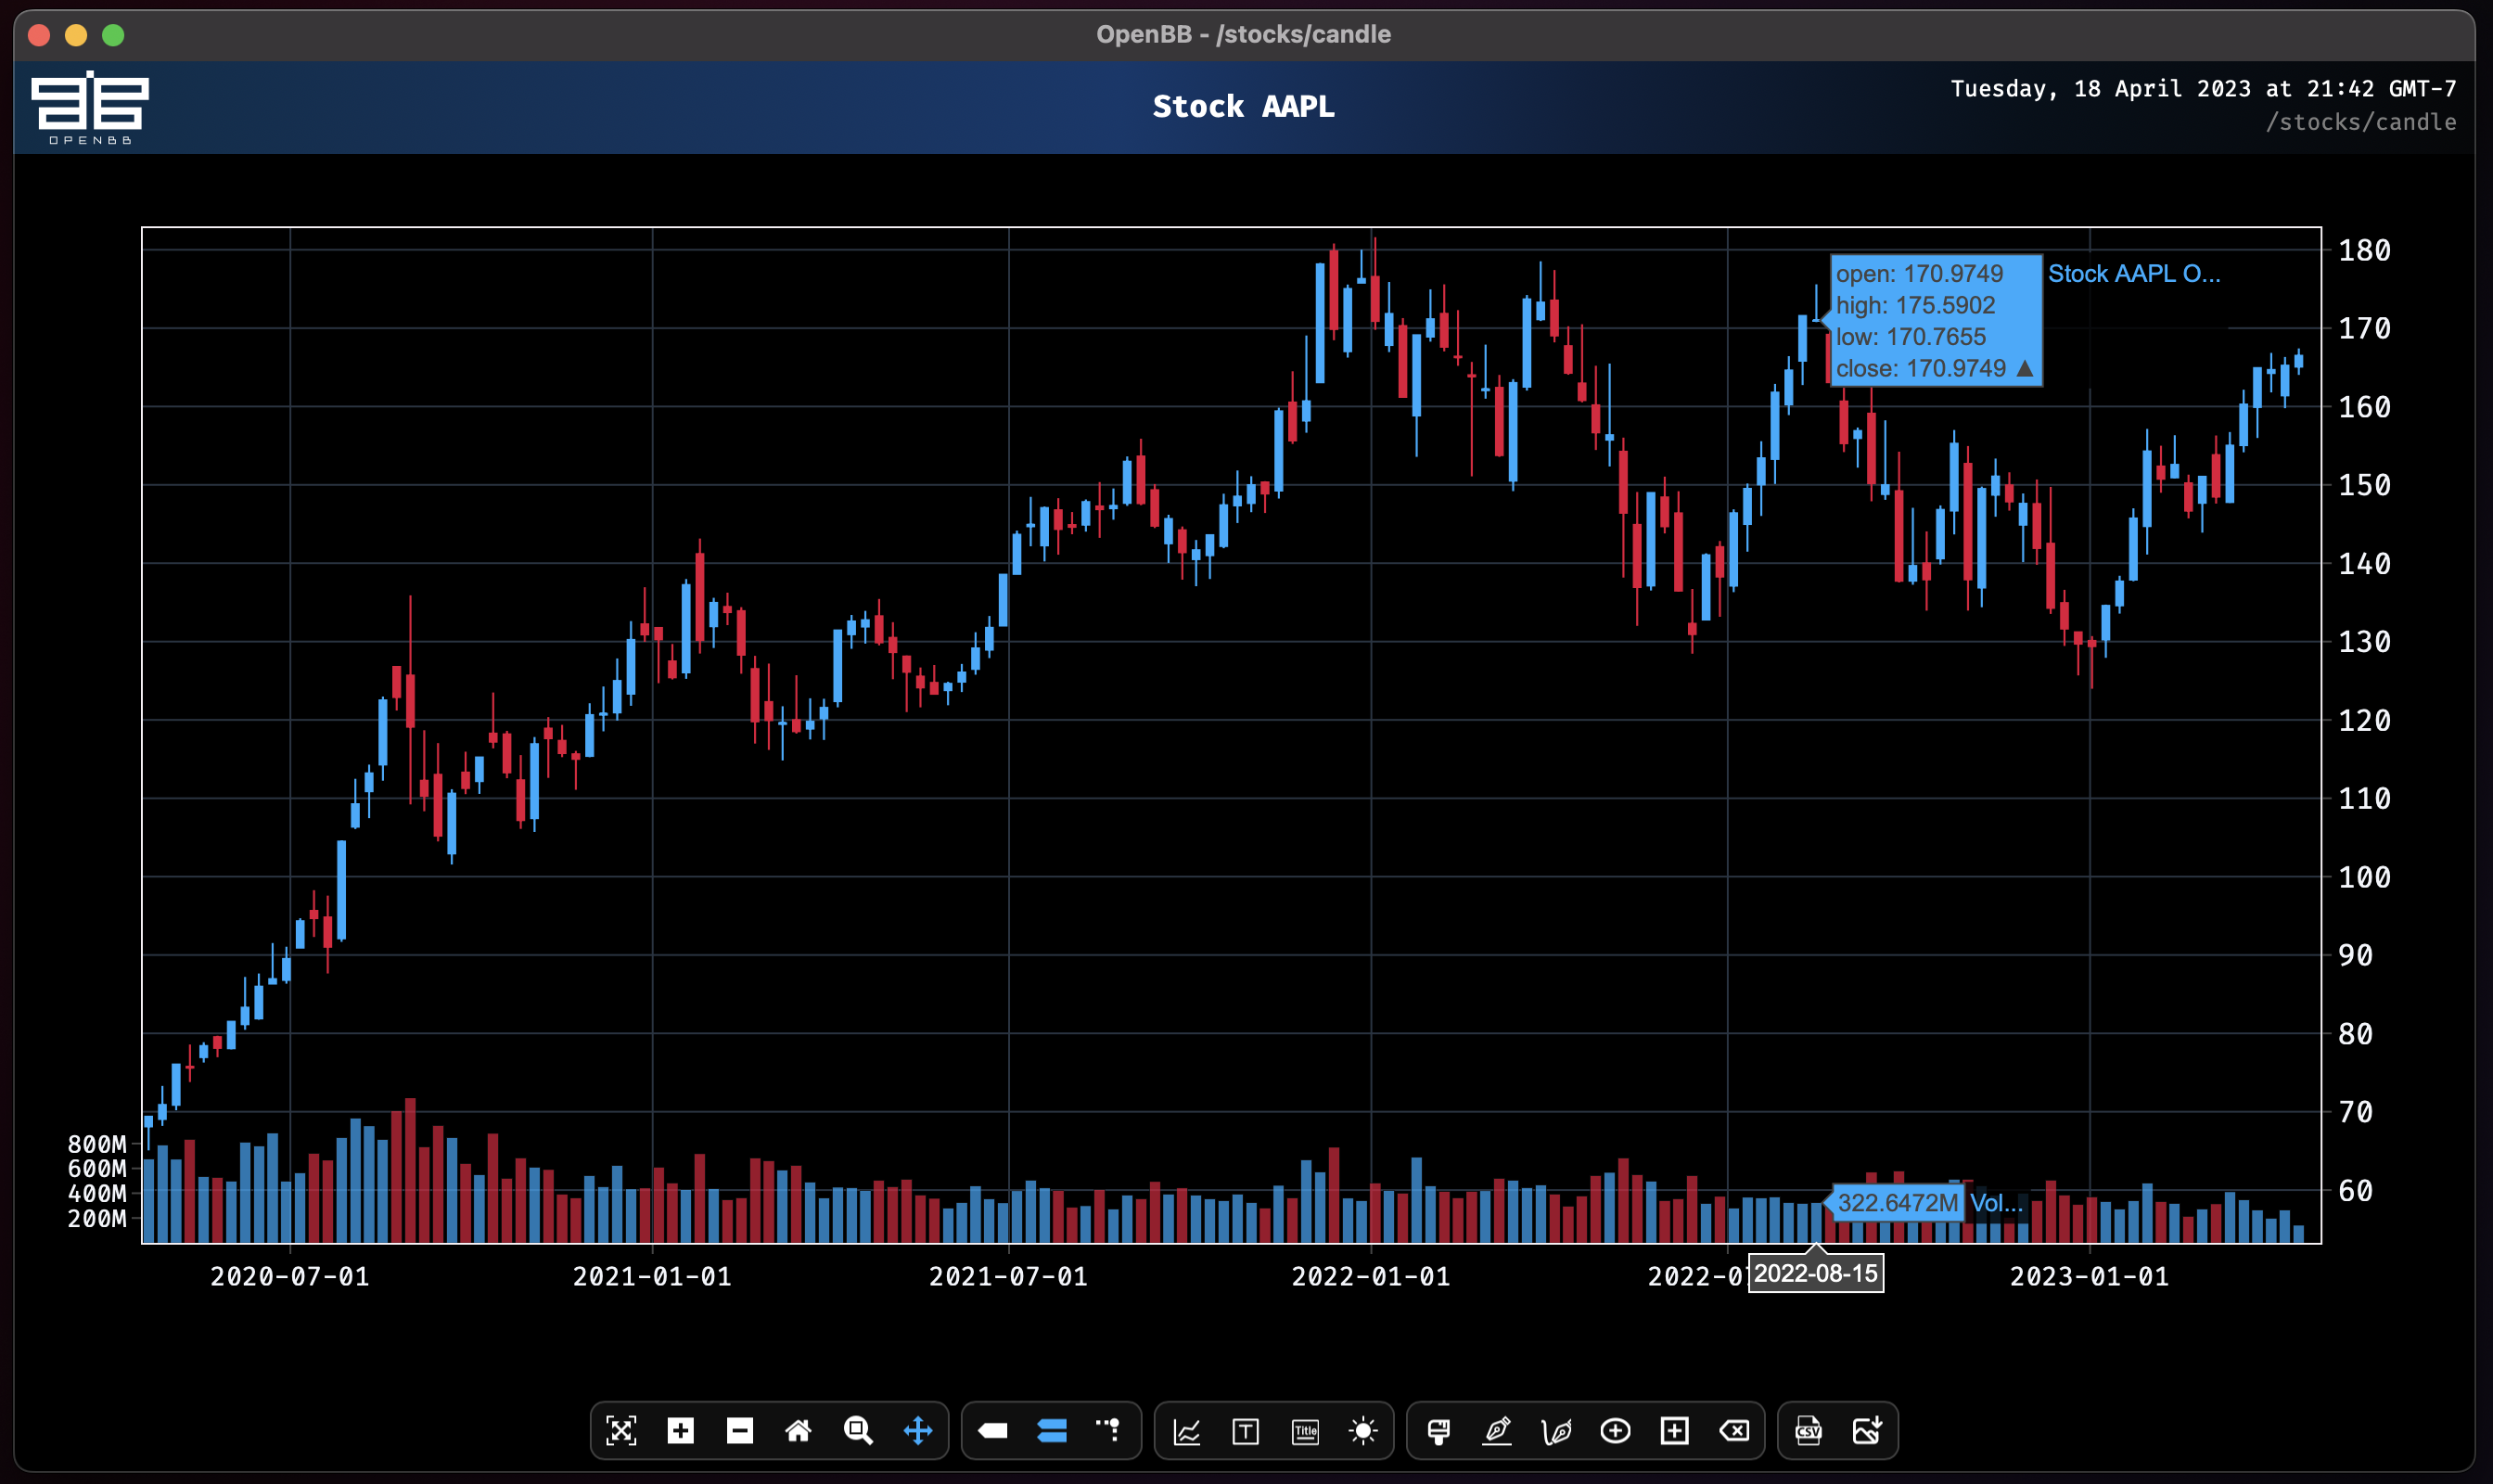
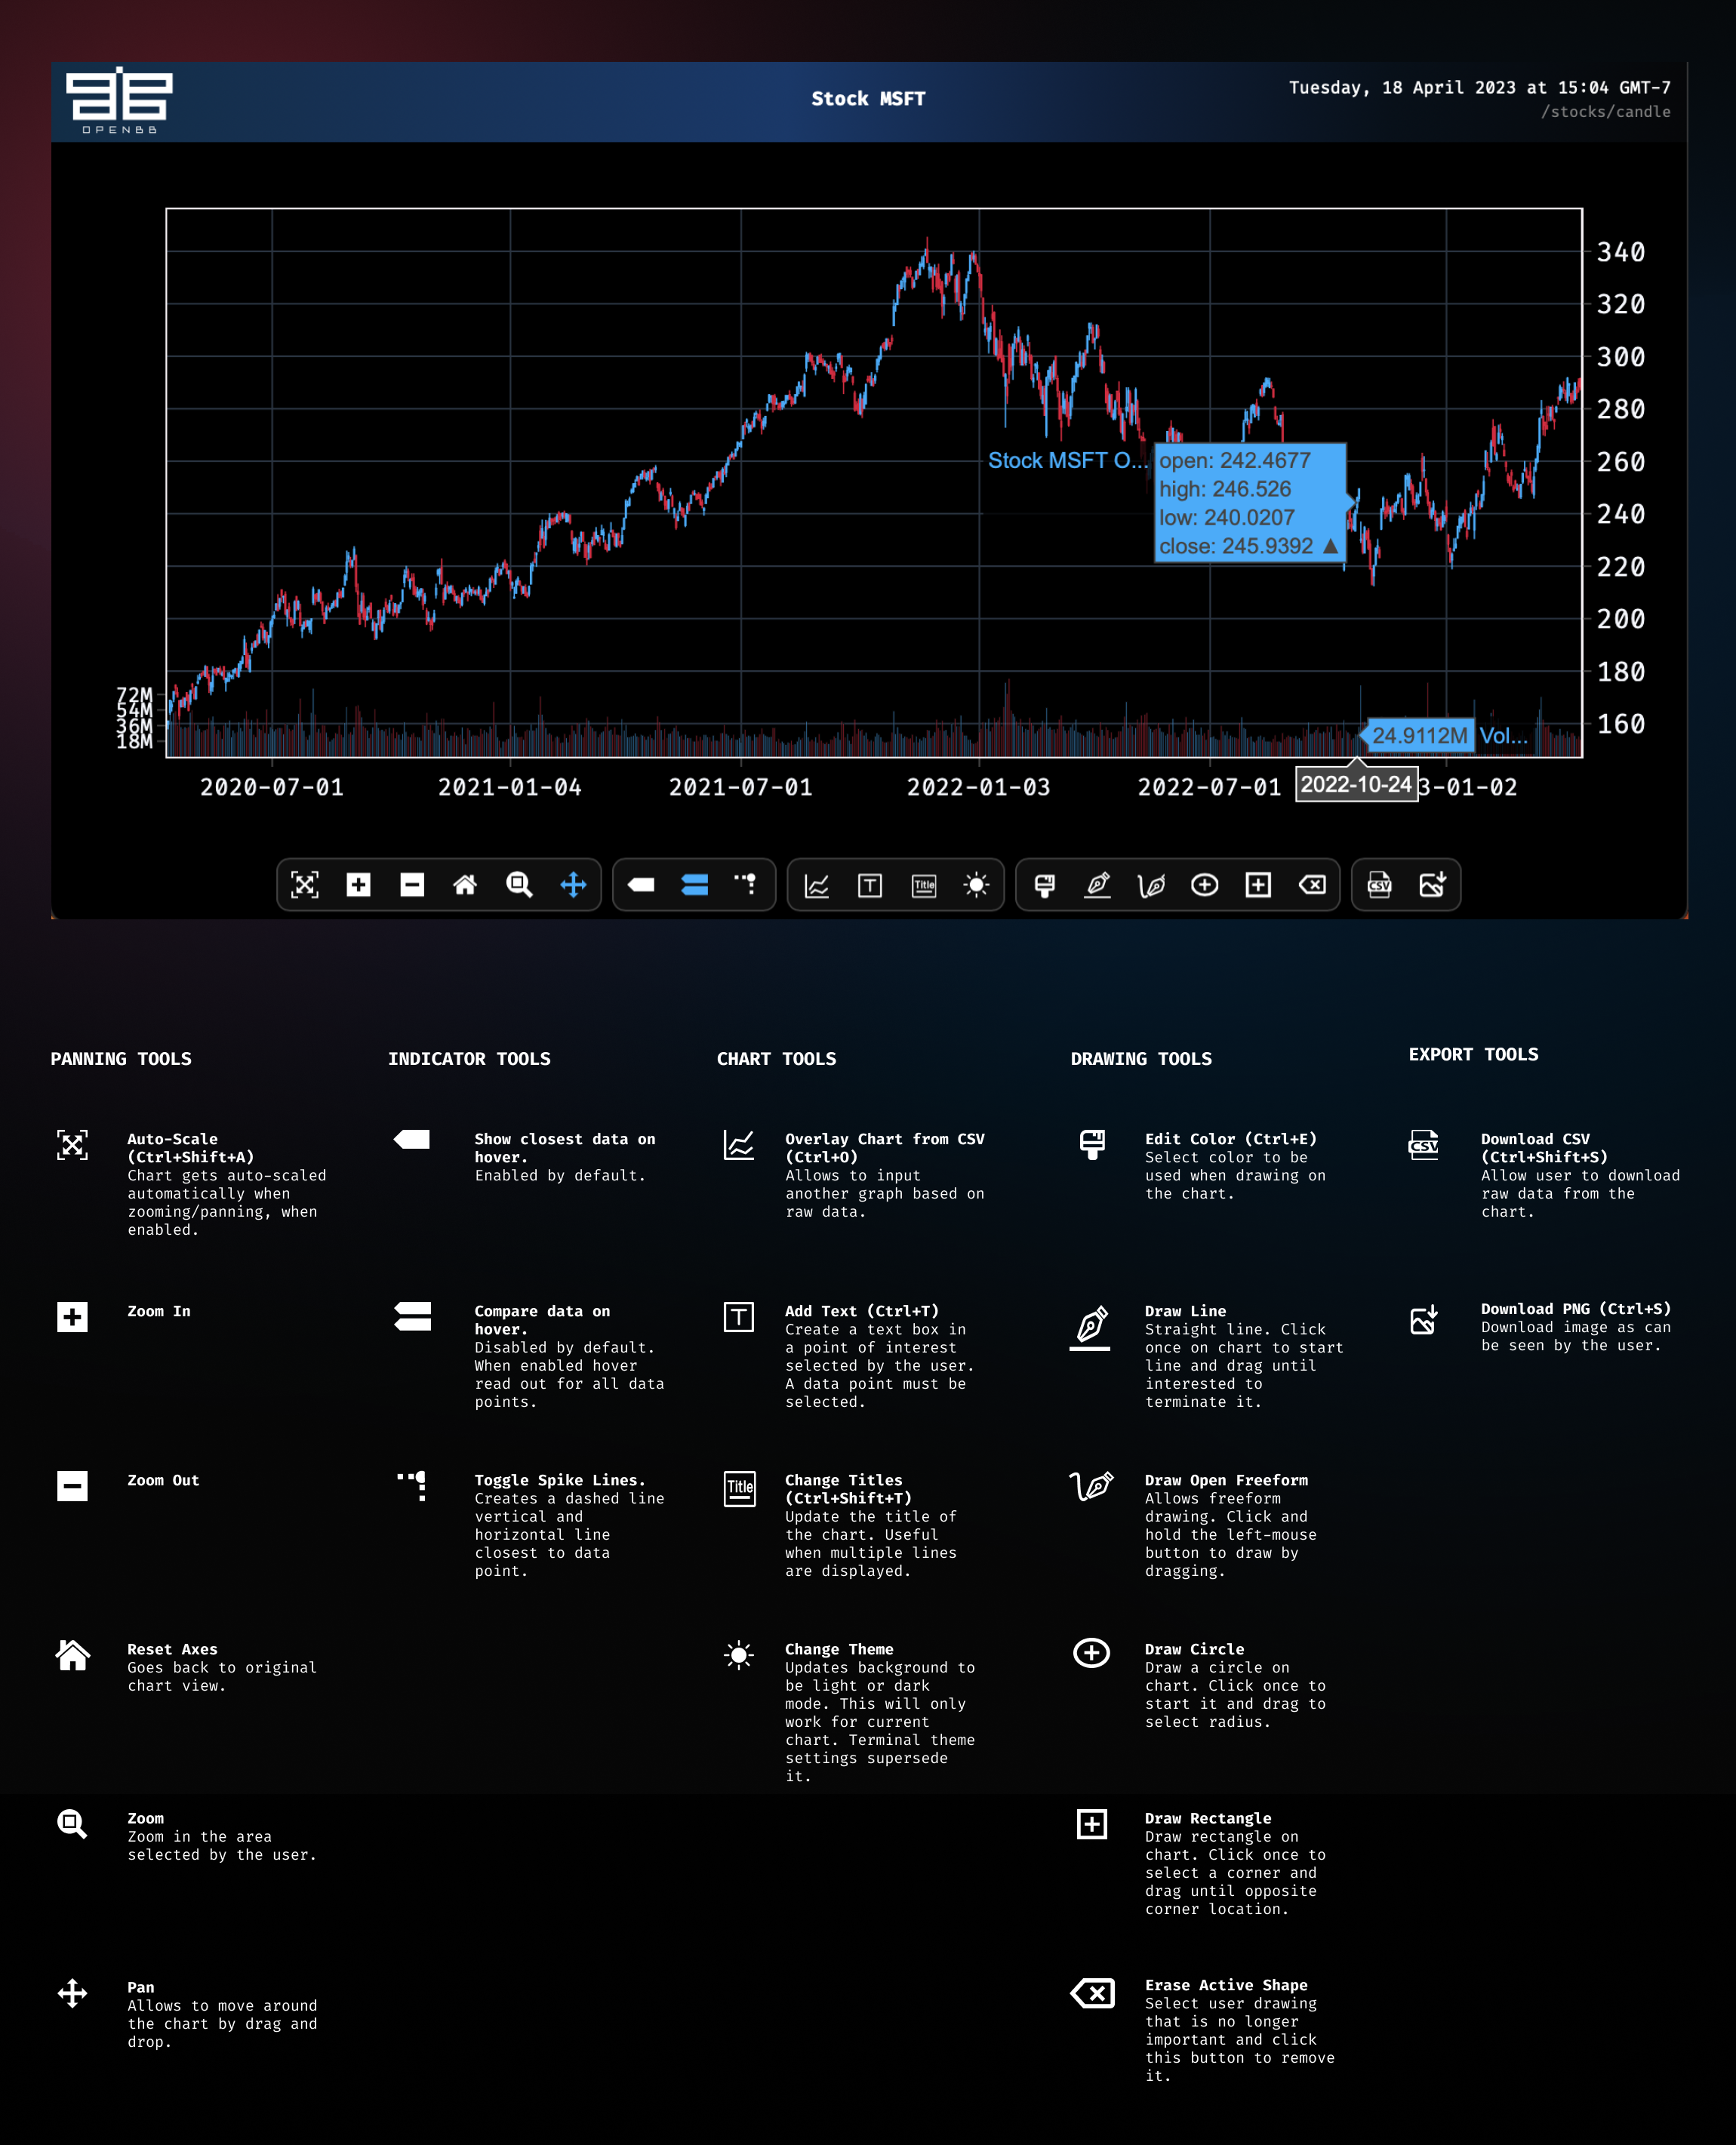
See the page here for a detailed explanation of the toolbar.
To create an empty figure object, import the OpenBBFigure class directly.
from openbb_terminal.core.plots import OpenBBFigure
fig = OpenBBFigure()
Chart Themes
Themes used by the charting and tables libraries are accessible in the SDK through a separate import statement.
from openbb_terminal import theme
Print the path to the location of the style files with:
theme.plt_styles_available
Set the charts theme as light or dark:
theme.apply_style('light')
Refer to the Plotly documentation for details on customizing style sheets.
Chart Cheat Sheet
Changing Data Sources
The source of the data can be specified - where more than one is available - by including the source argument in the syntax.
polygon = openbb.stocks.load("SPY", source = "Polygon")
eodhd = openbb.stocks.load("SPY", source = "EODHD")
av = openbb.stocks.load("SPY", source = "AlphaVantage")
intrinio = openbb.stocks.load("SPY", source = "Intrinio")
databento = openbb.stocks.load("SPY", source = "DataBento")
Support, Bug Reports & Feedback
Issues can be raised through the support page or on GitHub. You can also chat with the community on Discord to find help or inspiration. Feedback is always welcome.